
This sample Homicide Research Paper is published for educational and informational purposes only. Like other free research paper examples, it is not a custom research paper. If you need help writing your assignment, please use our custom writing services and buy a paper on any of the criminal justice research paper topics. This sample research paper on homicide features: 5400+ words (19 pages), an outline, APA format in-text citations, and a bibliography with 23 sources.
Outline
I. Introduction
II. Homicide Trends Over Time
A. The Crime Drop
B. Explanations for the Crime Drop
III. Race-Specific Homicide Trends
A. Divergence or Convergence
IV. Intimate Partner Homicide Trends
A. Exposure Reduction
B. Backlash or Retaliation
C. Economic Deprivation
V. Conclusion
I. Introduction
Criminal homicide is classified by the Uniform Crime Reporting (UCR) Program as both murder and nonnegligent manslaughter or as manslaughter by negligence. Homicide research generally examines murder and nonnegligent manslaughter, defined as the willful killing of one by another. Justifiable homicide, manslaughter caused by negligence, suicide, or attempts to murder are not included in this definition. For UCR purposes, justifiable homicide is limited to the killing of a felon by an officer in the line of duty or the killing of a felon, during the commission of a felony, by a private citizen. Manslaughter by negligence is the killing of a human being by gross negligence.
When researching homicide, scholars generally utilize two national sources of homicide data—the Uniform Crime Reporting Program of the Federal Bureau of Investigation (FBI) and mortality files from the Vital Statistics Division of the National Center for Health Statistics (NCHS). These two data sources vary greatly in the information collected.
The UCR is an official source of crime statistics based on reported crimes. That is, it is based on the number of arrests voluntarily reported to the FBI by law enforcement agencies. These crimes include murder, rape, robbery, aggravated assault, burglary, larceny-theft, vehicle theft, and arson. In addition to monthly criminal offense information compiled for UCR purposes, law enforcement agencies submit supplemental data to the FBI on homicide. Supplemental Homicide Reports (SHRs) contain supplemental information on homicide incidents. SHRs include detailed, incident-level data on nearly all murders and nonnegligent manslaughters that have occurred in the United States in a given year. These reports contain information for each homicide incident, including information on trends, demographics of persons arrested, and the characteristics of the homicide (i.e., demographics of victims, victim–offender relationships, weapon used, and circumstances surrounding the homicide).
Though a rich source of homicide data, the UCR Program has weaknesses of which researchers are well aware. Missing information regarding the homicide incident is problematic in the UCR and probably its main weakness. This may be due to the fact that participation by police agencies in the UCR Program is completely voluntary. Therefore, some law enforcement agencies fail to report their homicide incidents to the FBI or fail to fully record all relevant information. Despite this fact, official sources like the Bureau of Justice Statistics (BJS) have found that the SHRs are just over 90% complete. Though the coverage is high, there are still a number of homicides that go unaccounted for. Some researchers have taken steps to correct for underreporting by law enforcement agencies by statistically adjusting for the total number of homicide incidents reported to the UCR (see Fox, 2004). The ability to adjust for missing data based on known homicide cases has increased the popularity of this data source among researchers. However, one growing problem, particularly with homicide offender information, is the increase in the number of unsolved or uncleared murders by police agencies. Stranger homicides take longer to clear by arrest and therefore often get submitted as “unknown.” Ignoring homicides with missing offender information understates homicide offending. Thus, there is greater dependency on researchers to use weighting strategies that statistically adjust for missing offender data (see Fox, 2004, for a detailed discussion of this specific issue).
The mortality reporting system is far simpler compared to the UCR. In this system, homicide information is gathered by medical examiners in the completion of standardized death certificates. Once verified, death certificates are entered into a national mortality dataset by the NCHS. According to the NCHS, these data represent at least 90% of all homicides that have occurred in the United States. This type of data contains information on the victim of the homicide. Victim information includes demographics, occupation, education, time of death, place of death, and cause of death. Just as seen for the UCR, there are weaknesses in mortality data such as omissions and underreporting. Unfortunately, for a variety of reasons not all death certificates are received by NCHS, and in some incidents information on death certificates is not entered into mortality figures. In addition, unlike with the UCR, offender information is not available and unable to be collected. Even with these notable limitations, homicide remains the most accurately measured and reported offense relative to other types of criminal offenses.
One of the reasons these data issues are so critical is that researchers and policymakers are interested in documenting and understanding the changes in homicide offending over time. That is, researchers and policy makers alike want to know how much homicide offending is occurring, why homicides occur and if the level of homicide offending is increasing or decreasing in certain areas (i.e., states, cities, or counties) over time.
II. Homicide Trends Over Time
One of the most remarkable findings in the study of urban violence is that homicide rates fell sharply in U.S. cities in the 1990s. In fact, homicides plunged to their lowest point in 35 years, making this drop critical to any discussion of homicide. That is, any effort to understand homicide requires an examination of homicide trends over time, particularly this rather remarkable, unexpected crime drop of the 1990s. To that end, this research paper will provide statistical information on urban homicide trends since the 1980s, drawing specifically on SHRs. After documenting some important changes, some of the leading explanations for the crime drop will then be outlined, to give the reader an understanding of the level and nature of work being conducted to understand this precipitous decline.
A. The Crime Drop
Researchers use time series data of total homicide rates to document the crime drop. As stated in the introduction, homicide is the most accurately measured and reported offense, making it the best benchmark when trying to illustrate changes in criminal offending over time. In addition, homicide is the most serious crime, leading it to be the most widely used among academicians. For these reasons and others, homicides provide a useful and accurate account of crime trends.
Time series data show that homicides averaged 19.0 per 100,000 population in 1980, and rates tended to fluctuate between 19 and 22.5 until 1991, when homicides peaked (22.5 per 100,000 population). That is, examination of SHR data reveals that homicides dropped by 20% from 1980 to 1985, but then rose by 47% from 1985 to 1991. Starting in 1991, homicides started a steady decline until 2000, falling to their lowest rate in 2000, or a drop of 46%. Since 2000, the rate of homicide has been largely stable until 2006 or so when an increase was observed. Overall, SHR data have documented a dramatic rise in homicides in the late 1980s, followed by the precipitous decline in the 1990s. This incredible crime drop has gained widespread attention as scholars have searched for answers (FBI, 2008).
B. Explanations for the Crime Drop
The drop in homicide rates occurred without warning, leading to an explosion of newspaper articles, TV reports, and other media accounts. Scholarly attention soon followed with a list of potential explanations, including greater police presence, prison expansion, reduced handgun availability, tapering drug (specifically crack cocaine) markets, gains in the economy, and age shifts in the population (Blumstein & Wallman, 2001). While the list continues to grow, some of the explanations receiving the greatest attention in the literature are outlined below.
Rise in Imprisonment Rates. An understanding of the changes in crime rates cannot occur without some consideration of the political and legal context of the time period. The enormous growth in “get tough on crime” policies that began in the 1970s is no exception. The expansion of the incarcerated population started in the mid-1970s, and by 2000 more than 2 million persons were incarcerated— 4 times the prison population of 1970. Because the rise in incarceration rates corresponds closely with the decline in homicide rates, some researchers linked the two. For example, while homicides were dropping from 1991 to 2001 in large cities, the Bureau of Justice Statistics reports incarceration rates rose by 54.2% during this time period (a rate change of 310 to 478 per 100,000 residents nationally). The rise in incarceration, backed by structured sentencing (i.e., “get tough” on violent and drug-related criminal offenders) and other conservative criminal justice policies, is one of the longest trends documented in the literature. Given the steady and prolonged trends in both rates of violence and incarcerations, it is not surprising that a number of scholars argue for the association between the two.
Increase in Police Presence. One response to rising crime rates is to hire more police officers. There is evidence that this was indeed a response to crime trends based on annual figures in the UCR. These reports tell of more police on the street, particularly in the 1990s when the FBI reports an extra 50,000–60,000 officers nationally (Levitt, 2004). On average, the police force size was 236.1 per 100,000 city residents in 2000, up from 206.9 per 100,000 persons in 1980 in large U.S. cities (Parker, 2008).These trends provide scholars with reasons to argue that increasing police presence is a likely predictor of the crime decline in the 1990s.
Diminishing Drug Markets. A link between violence and illicit drug markets is another major theme in the crime drop debate. Crack cocaine markets, which grew throughout the mid-1980s and peaked in the early 1990s, were related to homicide trends during this same time period (Blumstein, 1995). In fact, researchers found that drug markets contribute to violence, and studies have pointed to crack cocaine patterns specifically as related to trends in urban violence (Blumstein & Rosenfeld, 1998; Cook & Laub, 1998; Goldstein 1985). While determining how to best capture the impact of drug markets has hindered much of this research, police arrests for drug (specifically cocaine) sales represent one way to tap the level of drug activity in a given area or city. The UCR has shown that drug arrests for sales/manufacturing have exploded, growing by two and a half times from 1982 to 2003 alone (from 137,900 to 330,600). Thus, evidence of the waning crack market in the 1990s, or at least the growing enforcement of drug sales in recent times, has placed drug markets at the forefront of the crime drop debate.

Improving Economy of the 1990s. The link between economic factors and crime cannot be understated, so it comes as no surprise that the economic improvements of the 1990s have gained attention as a plausible explanation for the crime decline. In fact, in accord with labor statistics, the unemployment rate rose during the recessions of the early 1980s and early 1990s, recovering after both periods. On the other hand, the unemployment rate steadily declined throughout the 1990s, where employment gains for males and females correspond to the crime drop of this period. The unemployment rate alone fell from 6.8 in 1991 to 4.8 in 2001 (a drop of 30% in 10 years). Other economic performance indicators suggest better times for many Americans in the 1990s, as well as growth in major industries like information technology and services. Given that the 1990s mark a time of sustained economic growth and prosperity, these economic improvements are likely contributors to the crime drop.
Guns and Gun Control Policies. Finally, while explanations derived from guns and gun control policies drew a lot of attention early in the crime drop debate, mainly because such a large percentage of homicides are gun-related (Cook & Laub, 1998), interest in this explanation has diminished over time. The early interest in the relationship between violent crime and firearms made sense—the rate of violent crimes committed with firearms rose in the 1980s and 1990s and subsequently dropped. But over time, scholars have downplayed the degree to which gun control and concealed weapon laws contributed to the crime drop (Levitt, 2004). For example, some researchers found that the percentage of total killings by young males remained stable during the time of the crime drop, which was troubling since young males are much more likely to use a gun in a homicide than others, and other researchers discovered that the passage of the Brady Act gun control legislation in 1993 had no influence on homicide trends. Adding to the downfall of this explanation, researchers evaluating gun buyback programs and other gun control policies found that these programs also had little to do with reduction in gun violence. Even the highly publicized concealed weapon laws link to lower violent crime came under scrutiny (Lott & Mustard, 1997) when researchers revealed that the decline in crime actually predated the passage of many concealed weapon laws.
Since many of these explanations represent early responses to the crime drop, the research paper will now turn to more recent trends in the study of homicide. Clearly understanding homicide trends, particularly the crime drop of the 1990s, remains a critical focus. Moving beyond time series data of total homicide rates, scholars have acknowledged that since homicide trends differ across groups (Blumstein & Rosenfeld, 1998; Cook & Laub, 2002; Parker, 2008), these characteristics need to be accounted for in the crime drop debate. Current examples include Heimer and Lauritsen’s (in press) examination of trends in violence against women; LaFree, O’Brien, and Baumer’s (2006) exploration into racial patterns in arrest rates for multiple violent offenses; and Parker’s (2008) effort to account for the role of local labor markets in the study of race-specific homicide trends since the 1980s. All of these efforts acknowledge the diversity in the American population, including the differential levels of involvement in violence by the various groups, and argue that accounting for the differences across groups will advance understanding of the crime drop. To illustrate, a closer look at homicide trends is offered, involving two specific characteristics— racial groups and intimate partners.
III. Race-Specific Homicide Trends
As described, the changes in total homicide rates since the 1980s were dramatic, particularly the now well-documented decline of the 1990s. But the reality is that the trends are even more striking when separated by racial groups during this time period. When homicide trends are examined for whites and blacks separately, for example, two important differences are revealed. First, the homicide victim rate among blacks is much higher, with more extreme peaks and drops than the white homicide rate or the total homicide rate (see Figure 1). In fact, the black homicide rate was 25.8 in 1980, as compared to 19.0 per 100,000 city residents for total homicide. Between 1980 and 1985, the drop in black homicide rates is similar to the rate drop in total homicides (16% versus 20%, respectively). The exception is a large dip in black homicide rates in 1987 (19.43 per 100,000 population). By the 1990s, however, the crime drop in black homicide rates was considerable in magnitude, marking a 45% drop; that is, the rate was nearly cut in half. Subsequent years, on the other hand, show an increase in black homicide rates during the 2000s (approximately ranging from 14.4 to 16.5 per 100,000).
Second, the change in white homicide rates over time is modest, to say the least, suggesting stability rather than variability when compared to black homicide rates and total homicide rates. That is, white homicide rates peaked in 1980, reaching a rate of 5.89 per 100,000 white residents, while in comparison, the total homicide rate peaked in the early 1990s. From 1980 to 1985, white homicide rates dropped 6.8% (from 5.89 to 5.49) and then dropped again in the late 1980s (a 4.5% drop), only to continue to descend throughout the 1990s and into 2000 by another 17%. This drop was far lower in magnitude when compared to total and black homicide rates. Overall, then, white homicides averaged 5 per 100,000 white residents throughout the 1980s and into the 1990s. By 1998, white homicide rates dropped below 5 per 100,000 white residents for the first time, staying in the mid to low 4s since then (Parker, 2008). Thus, among the notable differences in white homicide rates is the lack of a peak around 1991 and little to no change in offending rates throughout the 1990s. On the other hand, there were considerable shifts and fluctuations in the rates for black homicide rates and total homicide rates over the last three decades. These trends, specifically the differences across racial groups, required researchers to move the discussion away from total homicide rates. Furthermore, it drew attention to whether white and black homicide rates were converging for the first time.
Figure 1. Homicide Rate per 100,000 Residents in Total and by Race, 1980–2003 (Adjusted Supplemental Homicide Reports)
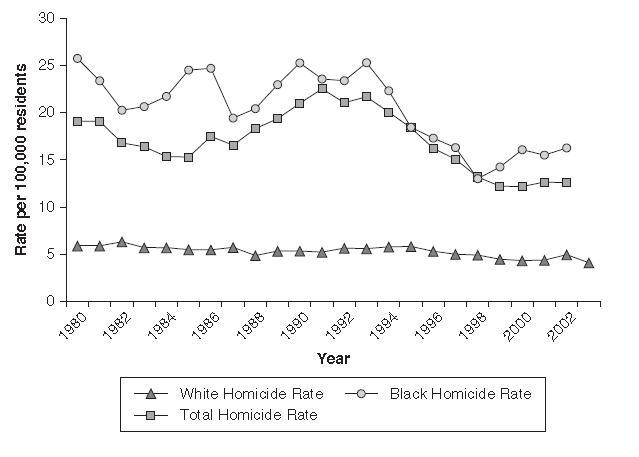
SOURCE: Parker, K. F. (2008). Unequal Crime Decline. New York: New York University Press.
A. Divergence or Convergence
The racial patterns in homicide trends reveal some interesting findings. First, the trends in black and total homicide rates are similar over time, but white homicide rates follow a different pattern. That is, while both black and total homicide rates experienced a decline in the early 1980s, followed by increases in the late 1980s, only to drop again in the 1990s, the decline in white homicide rates was more modest and steady over the 24-year period. An equally important issue is whether the racial gap in homicide is persisting or narrowing over time. Recent evidence suggests that the racial gap has indeed narrowed, and the racial disparities between groups have declined with the crime drop. That is, by examining the racial difference in homicide offending rates (based on the ratio of black to white homicide rates), it is now known that both black and white homicide rates decreased in the late 1990s and that the racial gap between these groups also narrowed considerably (in fact, by approximately 37%). This is an important reality about homicide that only recently gained attention, largely due to the work by LaFree et al. (2006), and it cannot be understated. In LaFree et al.’s work, they reveal that the black– white gap in violence was exceptionally high during the 1960s, but that gap has decreased over time. They argue that the narrowing of the racial gap is likely linked to the narrowing of crime-generating structural characteristics, such as social and economic indicators. According to LaFree et al., only by examining homicide trends separately by racial groups is it apparent that the racial gap has narrowed. Furthermore, evidence has surfaced that the narrowing of the gap is largely attributed to the rapid decline in black homicide rates during the 1990s, more than to any changes in white homicide rates (see Parker, 2008). This finding alone adds considerable weight to the efforts to diversify the study of homicide.
IV. Intimate Partner Homicide Trends
Intimate partner homicide has also gained attention in recent years, partly because of the efforts by feminist scholars to bring awareness to violence among intimate groups. While intimate partners (i.e., spouses, ex-spouses, boyfriends, and girlfriends) make up approximately 11% of all homicides, females are much more likely to be killed by an intimate partner than males. According to the Bureau of Justice Statistics, while both the number of male and female victims of intimate partner homicides dropped from 1976 to 2005, the number of males killed by an intimate partner had the most significant drop (75%) since 1976. On the other hand, the decline for females killed by an intimate partner was only witnessed after 1993 (see Figure 2).
As research in this area grows, descriptive accounts reveal that intimate partner homicide trends differ not only by the gender of the victim and offender, but also by the type of victim–offender relationship and the race of the victim (Browne & Williams, 1993; Gallup-Black, 2005; Puzone, Saltzman, Kresnow, Thompson, & Mercy, 2000). Essentially, while total intimate partner homicide has decreased over time, much like total homicide rates, once these rates are examined separately by gender, relationship type, or race, significant differences emerge. For instance, males have experienced a greater decline in intimate partner homicide victimization than females, and blacks more so than whites. In addition, intimate partner homicide among married persons has decreased, but homicide involving nonmarried persons has increased over time. In fact, the rise in nonmarried intimate partner victimization is most pronounced among white females. A number of reasons for the specific trends in violence among intimate partners, particularly the differences across gender and relationship type over time, have been offered. Some of these explanations are outlined here.
Figure 2. Intimate Partner Homicides by Gender, 1976–2005
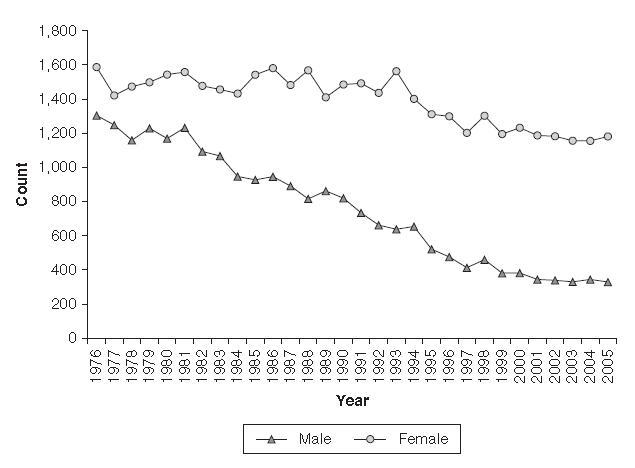
SOURCE: Federal Bureau of Investigation. (2008). Supplemental Homicide Files. Washington, DC: Bureau of Justice Statistics.
A. Exposure Reduction
The exposure reduction hypothesis proposes that factors that reduce the exposure or contact between violent intimate partners should decrease the probability of intimate partner homicide, because the opportunity for violence would be removed. A number of factors have been examined to determine the exposure reduction effects on intimate partner homicide. These factors include access to domestic violence resources, declining domesticity, and improved economic status of females.
Access to domestic violence resources, specifically the availability of legal (i.e., presence of statutes pertaining to domestic violence) and extra-legal services (i.e., number of shelters and other programs), is related to the decline in the rates of female-perpetrated intimate partner homicide, but less so for male-perpetrated intimate partner homicide (Browne & Williams, 1989; Dugan, Nagin, & Rosenfeld, 1999, 2003). On the other hand, research has also shown that some domestic violence resources (e.g., prosecutors’ willingness to prosecute) have the unintended consequence of putting women more at risk for intimate partner homicide victimization (Dugan et al., 2003). Because the role of domestic violence resources has been largely inconclusive, increasing divorce rates, declining marriage rates, an improved economic status of women, as well as other economic conditions, have received attention, partly because they consistently have been found to predict intimate partner homicide (Dugan et al., 1999, 2003; Reckdenwald, 2008; Rosenfeld, 1997).
Reflecting a decline in domesticity, rising divorce rates and the general trend toward declining marriage in the United States have surfaced as strong predictors of intimate partner homicide largely because these factors reduce the exposure to violence. For instance, divorce rates would result in fewer married couples living together and would therefore reduce the exposure of violent couples. The same idea applies to falling marriage rates, which would reduce the exposure of violent couples because fewer individuals would be getting married and living together. Rosenfeld (1997) examined intimate partner homicide trends in St. Louis, Missouri, and found that 30% of the decline in African American spousal homicides was attributable to falling marriage rates and rising divorce rates.
However, decreasing marriage rates may mean that more individuals are cohabitating without getting married. Cohabitation has been shown to be an important risk factor in intimate partner homicide. Wilson, Johnson, and Daly (1995) found that females that cohabitate with their partner are 9 times more likely to be killed by their intimate partner than are married females. Interestingly, other researchers have found that cohabitating men with female partners are 10 times more likely to be victims of intimate partner homicide compared to men in married relationships.
Improvement in the economic status of women has an exposure-reducing effect, reducing the rates of intimate partner homicide. Improvements such as higher educational attainment, income, and employment increase the opportunities available to women, and thus reduce the likelihood that they will resort to killing their male partners. Dugan et al. (1999) found that females’ improved status was associated with a reduction in intimate partner homicide victimization, particularly male intimate partner homicide victimization. That is, the increase in females’ relative income is associated with a decline in married female–perpetrated homicide. Furthermore, an increase in females’ relative educational attainment is associated with a decline in nonmarried male victimization. They suggest that “more educated women are better able, and perhaps more willing, to exit violent relationships and thus avoid killing their partner” (pp. 204–205).
B. Backlash or Retaliation
While research has shown the importance of reducing the exposure between intimate partners in violent relationships, it is well-known that the highest risk for homicide is when the victim leaves the relationship, and this is especially true for females who are killed by their male partners (Block, 2000). Thus, retaliation by the abusive partner from domestic violence interventions is another important consideration. Dugan et al. (2003) found a retaliation effect where domestic violence resources actually increased homicide between intimate partners because they failed to effectively reduce exposure between intimate partners. In fact, the prosecutor’s willingness to prosecute violators of protection orders, though intended to reduce exposure between violent intimate partners, actually caused a retaliation effect where homicide increased for married and unmarried white females and African American unmarried males. They concluded that “being willing to prosecute without providing adequate protection may be harmful” (p. 192). Reckdenwald (2008) also found that the number of shelters per 100,000 females was significantly related to intimate partner homicide. Despite all the efforts to increase shelter availability to females in violent relationships, it appears that the increase in availability is actually associated with an increase in intimate partner homicide. For instance, in 1990 and 2000, the increase in the shelter rate was related to an increase in male-perpetrated intimate partner homicide. It was concluded that efforts to prevent domestic violence and homicide need to also provide adequate protection during times that are characterized by increased violence.
C. Economic Deprivation
Aside from exposure reduction and retaliation effects, recent research has explored the link between economic deprivation and intimate partner homicide over time (Reckdenwald, 2008). The main idea is that, even though women have experienced improvements economically since the 1960s, they still lag behind their male counterparts in regard to occupational prestige and income levels. Furthermore, women are much more likely to be impoverished than males. Economic deprivation arguments allows researchers to tap the influence of poverty, unemployment, and the dependency on public assistance on the trends in male- and female-perpetrated intimate partner homicides over time, particularly since patterns of intimate partner homicide involving males and females diverge over time. Reckdenwald (2008) found that cities that had the greatest levels of change in female poverty, unemployment, and public assistance from 1990 to 2000 were also areas that experienced significant changes in female-perpetrated intimate partner homicides, suggesting that trends in such homicide were largely influenced by persisting economic deprivation among females.
As noted, overall attempts to explain the different trends in male and female intimate partner homicide have examined a number of different factors, including domestic violence resources, declining domesticity, improving economic status of females, and economic deprivation. Though a conclusive explanation has not surfaced, separating homicide trends by gender and the victim–offender relationship gives a better understanding of the nature of the crime drop in the 1990s.
V. Conclusion
The study of homicide invokes a scientific investigation of the frequency, nature, and causes of one human being killing another. As researchers explore criminal homicide, they tend to examine murder and nonnegligent manslaughter as defined by official sources (such as the UCR), which excludes justifiable homicide, manslaughter caused by negligence, suicide, or attempted murders. There are generally two national sources of homicide data—the Uniform Crime Reporting Program of the FBI and mortality files from the Vital Statistics Division of the National Center for Health Statistics. Even though these data sources are not without limitations, particularly as they relate to missing data on key characteristics of victims or offenders involved in these incidents, homicide remains the most accurately recorded and documented offense relative to other types of criminal behavior.
One of the most critical questions facing scholars and policymakers today is this: Why did homicide rates decline so considerably during the 1990s? As described here, UCR Supplemental Homicide Reports show that homicide rates fell sharply in U.S. cities in the 1990s. In fact, homicides were almost cut in half, declining approximately 46% during this 10-year period and plunging to their lowest point in 35 years. Scholars have offered a number of potential explanations, including greater police presence, prison expansion, reduced handgun availability, tapering drug (specifically crack cocaine) markets, gains in the economy, and age shifts in the population. Unfortunately, a lack of data and other measurement issues restrict definitive tests of these ideas and explanations.
Because the reasons for the crime drop remain largely unanswered, scholars have moved toward both documenting the potential differences in homicide trends across specific groups and exploring the nature of homicide trends in more detail. Two examples of recent efforts are provided: (1) the study of racial patterns in homicide trends and evidence of a convergence in black and white homicide rates over time and (2) research on how homicide among intimate partners differ by gender of the victim, type of relationship, and race, and recent attempts to explain the different trends in intimate partner homicides over time. As these examples clearly show, total homicide rates mask the nature of the crime drop, ignoring the diversity in trends and differences in life circumstances across groups based on race, gender, and other characteristics. The reality of the crime drop and an understanding of homicide trends over time require moving beyond a general investigation of total homicide rates to explore homicides among distinct groups more closely.
See also:
Bibliography:
- Block, C. R. (2000). The Chicago Women’s Health Risk Study. Risk of serious injury or death in intimate violence: A collaborative research project [Final report to the National Institute of Justice]. Retrieved August 21, 2013, from http://www.icjia.state.il.us/public/pdf/cwhrs/cwhrs.pdf
- Blumstein, A. (1995). Youth violence, guns, and the illicit-drug industry. Journal of Criminal Law and Criminology, 86(1), 10–36.
- Blumstein, A., & Rosenfeld, R. (1998). Explaining recent trends in U.S. homicide rates. Journal of Criminal Law and Criminology, 88, 1175–1216.
- Blumstein, A., &Wallman, J. (2001). The crime drop in America. New York: Cambridge University Press.
- Browne, A., & Williams, K. R. (1989). Exploring the effect of resource availability and the likelihood of female-perpetrated homicides. Law and Society Review, 23, 75–94.
- Browne, A., & Williams, K. R. (1993). Gender, intimacy, and lethal violence. Gender & Society, 7, 78–98.
- Cook, P., & Laub, J. (1998). The unprecedented epidemic in youth violence. In M. Tonry & M. H. Moore (Eds.), Youth violence: Crime and justice (Vol. 24, pp. 27–64). Chicago: University of Chicago Press.
- Cook, P., & Laub, J. (2002). After the epidemic: Recent trends in youth violence in the United States. In M. Tonry (Ed.), Crime and justice: A review of research: Vol. 4 (pp. 1–37). Chicago: University of Chicago Press.
- Dugan, L., Nagin, D. S., & Rosenfeld, R. (1999). Explaining the decline in intimate partner homicide: The effects of changing domesticity, women’s status, and domestic violence resources. Homicide Studies, 3, 187–214.
- Dugan, L., Nagin, D. S., & Rosenfeld, R. (2003). Exposure reduction or retaliation? The effects of domestic violence resources on intimate-partner homicide. Law & Society Review, 37, 169–198.
- Federal Bureau of Investigation. (2008). Supplemental homicide files. Washington, DC: Bureau of Justice Statistics.
- Fox, J. A. (2004). Missing data problems in the SHR. Homicide Studies, 8, 214–254.
- Gallup-Black, A. (2005). Twenty years of rural and urban trends in family and intimate partner homicide. Homicide Studies, 9, 149–173.
- Goldstein, P. J. (1985). The drug-violence nexus:A tri-partite conceptual framework. Journal of Drug Issues, 15, 493–506.
- Heimer, K., & Lauritsen, J. L. (in press). Gender and violence in the United States: Trends in offending and victimization. In R. Rosenfeld & A. Goldberger (Eds.), Understanding crime trends. Washington, DC: National Academy Press.
- LaFree, G., O’Brien, R., & Baumer, E. (2006). Is the gap between black and white arrest rates narrowing? National trends for personal contact crimes, 1960 to 2002. In R. Peterson, L. Krivo, & J. Hagan (Eds.), The many colors of crime: Inequalities of race, ethnicity, and crime in America (pp. 179–198). New York: New York University Press.
- Levitt, S. D. (2004). Understanding why crime fell in the 1990s: Four factors that explain the decline and six that do not. Journal of Economic Perspectives, 18, 163–190.
- Lott, J. R., & Mustard, D. B. (1997). Crime, deterrence, and right-to-carry concealed handguns. Journal of Legal Studies, 26, 1–68.
- Parker, K. F. (2008). Unequal crime decline: Theorizing race, urban inequality, and criminal violence. New York: New York University Press.
- Puzone, C. A., Saltzman, L. E., Kresnow, M-J., Thompson, M. P., & Mercy, J. A. (2000). National trends in intimate partner homicide. Violence Against Women, 6, 409–426.
- Reckdenwald, A. (2008). Examining trends in intimate partner homicide over time, 1990–2000. Unpublished doctoral dissertation, University of Florida, Gainesville.
- Rosenfeld, R. (1997). Changing relationships between men and women: A note on the decline in intimate partner homicide. Homicide Studies, 1, 72–83.
- Wilson, M., Johnson, H., & Daly, M. (1995). Lethal and nonlethal violence against wives. Canadian Journal of Criminology, 37, 331–361.
Free research papers are not written to satisfy your specific instructions. You can use our professional writing services to order a custom research paper on criminal justice and get your high quality paper at affordable price.
ORDER HIGH QUALITY CUSTOM PAPER

Always on-time

Plagiarism-Free

100% Confidentiality

