
This sample The Economics of Fair Trade Research Paper is published for educational and informational purposes only. Like other free research paper examples, it is not a custom research paper. If you need help writing your assignment, please use our custom writing services and buy a paper on any of the economics research paper topics.
After oil, coffee is the most traded commodity in the world. Like all commodities, coffee prices have -historically been quite volatile. Coffee, unlike other internationally important commodities, is frequently produced by small family-run operations. As such, volatile and unpredictable coffee prices leave coffee producers in a vulnerable and precarious position. Furthermore, coffee is an important source of export earnings and foreign exchange for many countries, particularly developing countries. This is due to the geography of coffee. Coffee is a tree crop that thrives when grown at an altitude along the equator, situating it principally in developing countries. Fluctuating coffee prices create income uncertainty for households and nations that rely on coffee earnings.
There is a long history of intervention in commodity markets to control prices. The Organization of the Petroleum Exporting Countries (OPEC) is a well-known example of intervention to manipulate prices. Fair trade is an alternate trade arrangement that aims to both raise earnings and reduce income variability for coffee producers. Instead of manipulating supply as OPEC does, fair trade is a voluntary market-based response allowing consumers to express their preferences by choosing to pay a premium for goods produced in accordance to fair trade standards. As such, fair trade can be seen as a social response to market forces and needs to be understood as a response to poverty and globalization.
Background
There are two types of coffee beans: Arabica and Robusta. Arabica beans are generally considered to be of higher quality and superior taste. Both types of coffee grow in tropical climates. Arabica is grown at higher altitudes, typically between 3,000 to 6,000 feet above sea level with temperatures between 59 and 75 degrees Fahrenheit year round, while Robusta grows from sea level to 3,000 feet. Robusta is more tolerant of heat, but both are very sensitive to rainfall and frost. Coffee requires roughly 60 to 120 inches of rainfall per year with a dry season during which the harvesting occurs (Wrigley, 1988). These conditions position prime coffee production along the equator in developing countries.
Coffee is a tree crop, and the trees take 3 to 5 years to mature before they bear viable fruit. Coffee itself is the seed contained within the fruit from the coffee tree. The fruit is harvested then pulped to extract the seeds, which are then dried for export as green beans. The lag between planting and coffee production is one of the factors that often leads to price instability. When prices are high, growers have an incentive to expand production. However, prices can remain high for a few years before supply can be increased, as farmers plant additional trees and wait from them to mature. Given the high level of poverty and limited income opportunities in most coffee-producing countries, price increases provide strong incentives to increase output. When the trees mature, supply rapidly increases, and all else constant, price falls. On the other hand, when prices are low, many farmers can no longer afford to grow coffee. They begin to neglect the trees or even destroy them as they move to a new crop. This leads to a cut in supply, and a new cycle begins.
Figure 49.1 shows the price in U.S. cents per pound of green coffee. The composite price is constructed from daily averages of green coffee from the three major global coffee markets: New York, Germany, and France. Prices range from a high of 314.96 cents per pound in 1977 to a low of 37.22 cents per pound in 1967.
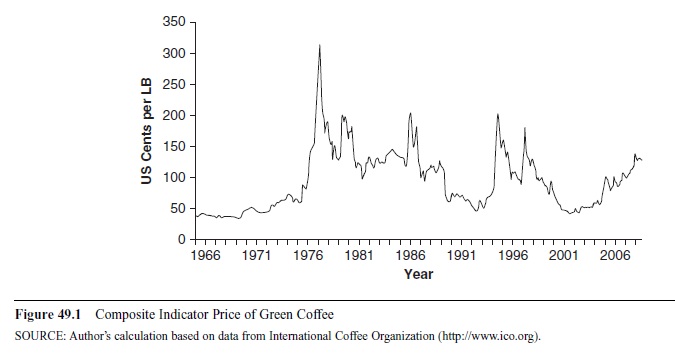 Figure 49.1 Composite Indicator Price of Green Coffee
Brazil, one of the world’s largest producers of coffee, experienced a severe frost in 1975. The Institute) Brasileiro do Café (IBC) reported that 50% of the crop had been destroyed. The frost occurred after harvesting had begun, so the effect on prices was not felt until the following year. With a drastic reduction in supply, prices spiked upward in 1976 and 1977. The price increase encouraged an expansion of coffee planting, both to replace the damaged plants and to try to take advantage of higher prices. The first of this coffee began to enter the market in 1980, increasing supply and resulting in falling prices. Further boom and bust cycles were experienced in 1986, 1997, and 1999 due to droughts in Brazil and in 1994 when Brazil was hit by another frost.
These price cycles leave producers and nations that rely on coffee revenue in a precarious position. Low and unstable income limits households’ ability to save, acquire assets, or invest in their production. With little or no savings or assets, households cannot borrow to smooth consumption in economic downturns. Lacking savings or access to credit, households are forced to cut consumption and may remove children from school as coffee prices fall. Low and unstable income also leaves individuals vulnerable to illness or accidents. Cuts to consumption lead to poor nutrition and inadequate health care, increasing the likelihood of illness, which can be devastating to the household. The effects of illness and injury are twofold. Caring for the ill or injured creates an additional burden due to medical costs. Also, the opportunity cost of lost earnings for the caregiver and the injured or ill can be profound.
The impact of price fluctuations is not restricted to households. Nations relying on coffee exports for government revenue and foreign exchange are similarly affected. Falling government revenues necessitate cuts in spending, particularly for social support programs such as access to health services, education, and nutritional aid. These cuts in government spending fall disproportionately on the poor and most vulnerable in society.
Weather is not the only source of instability in the coffee market. Global supply and demand conditions also affect coffee prices. Recessions in coffee-drinking countries trickle down to lower prices for farmers. These green coffee prices are set in commodity markets, such as the New York Board of Trade (NYBOT).
The NYBOT serves as the industry benchmark for green coffee beans and clears the market based on future contracts. The Inter-Continental Exchange (ICE) coffee futures market was established in 1882 to promote price stability in the coffee industry. According to the ICE, the coffee market has exhibited greater historic volatility than other commodity markets. This volatility leads to more hedging as traders look to avoid price risk. Coffee traders can reduce risk by buying contracts that fix the price for coffee to be delivered in the future. Traders can also speculate in the coffee market, increasing price volatility. Unlike traders, most coffee growers do not have access to insurance or other markets that would allow them to reduce risk.
Various attempts to reduce price and earning volatility for coffee growers have been instituted over time. Fair trade is the latest in a serious of pro-poor trade regimes. Fair trade is a partnership between coffee consumers in relatively wealthy nations and coffee growers in poor nations. It is designed to promote greater equity in international trade and sustainable development while protecting workers rights. Fair trade operates as a certification process. International certifiers require producers to meet certain standards to qualify for the fair trade label. The fair trade model can be applied to a variety of goods; however, it is principally applied to edible commodities. This research paper will focus on coffee, the mainstay of the fair trade movement.
Origins of Fair Trade
The rise of fair trade came out of the confluence of two events: changes in global market conditions and the rising international social justice movement. Global markets were dramatically affected by the rise of structural adjustment policies leading to prolonged and often painful economic restructuring. In the same period, there was growing awareness of the immiseration of the working poor globally.
Structural Adjustment Policies
Structural adjustment was a set of policies promoted principally by the World Bank and International Monetary Fund (IMF) designed to stabilize countries’ balance of payments. Following the classical model of international trade, nations focused on areas of comparative advantage. This resulted in industrial countries focusing on industrial goods while poorer, less developed countries relied on agricultural and unprocessed primary goods. Trade in this manner should, according to standard economic models, lead to falling opportunity costs for imported goods and therefore rising standards of living and welfare for all nations.
This premise was called into question by Raul Prebisch, executive secretary of the United Nations Economic Commission for Latin America and the Caribbean (ECLAC) and later secretary-general of the United Nations Conference on Trade and Development (UNCTAD). Prebisch (1971) showed that the terms of trade, the quantity of foreign goods (imports) that were exchanged for a unit of domestic goods (exports), were falling. The implications are that foreign, manufactured goods were becoming more expensive. As each export from the developed world was exchanged for ever increasing amounts of primary goods from developing countries, trade was seen as exploitive— leading to higher standards of living in the industrial countries but not in the less developed countries.
Prebisch (1971) noted some of the causes of the declining terms of trade—in particular, falling income elasticity of demand for primary goods and growing protection of domestic markets in developed countries. Industrialized nations experienced rapid gains in productivity in the 1950s. The increase in output generated an expansion in international trade as markets were found for the additional output. This led to rising wages and income in the industrial countries. As incomes rose, demand for manufactured goods also increased, further expanding income in the industrialized countries.
Unfortunately, producers of primary goods in developing countries did not benefit from the rising income in industrial countries. As incomes were rising in industrial countries, the income elasticity of demand for primary goods was falling. Demand for output from developing countries was not keeping pace with demand for manufactured goods. Prices of manufactured goods were rising faster than primary goods, widening the income gap between First World and Third World nations and contributing to the declining terms of trade. At the same time, many industrialized countries bowed to domestic pressure and imposed trade restrictions on many agricultural and light manufactured goods. Producers in developing countries faced the twin threats of declining demand for their goods and reduced market access for exports.
Prebisch (1971) concluded that prices for goods from the industrialized nations would continue to rise relative to the less developed nations. Faced with declining terms of trade, economic growth and development through trade seemed impossible. For Prebisch, trade clearly did not make everyone better off. While trade would lead to material improvements for wealthy nations, the majority of the world would face immiseration, producing raw materials or lightly processed primary goods for the developed world, resulting in low productivity and pay for Third World nations for the foreseeable future.
For Prebisch and others, the road to higher standards of living required industrialization. Industrialization, however, would raise living standards in developing countries only if there was demand for output. Given the differences in capital and productivity, there was no way these infant industries could compete with multinational corporations dominating international trade. Successful industrialization required intervention.
The intervention used in many developing countries was import substitution industrialization (ISI). ISI was a growth strategy that focused on domestic industrialization. Realizing that domestic industry was incapable of competing with experienced and well-funded multinational corporations, many developing countries focused on producing for the domestic market with the hopes of eventually being able to compete internationally. To gain a competitive advantage in the domestic market, governments adopted restrictive policies on imports. Governments used a variety of tools, including tariffs, quotas, and exchange rates, to raise the price of selected imports. This created space for domestic production. Taking advantage of reduced competition and government support, new industries emerged to fill the demand for manufactured goods.
The initial effects of import substitution were promising. Many countries reported economic growth, rising employment, and reductions in poverty. New challenges, however, soon emerged. The very strategies adopted to create space for domestic producers reduced the efficiency of exporters. The shift into new industries increased domestic competition for inputs. This led to rising wages and resource prices, increasing costs for traditional exports in the agricultural sector and ultimately inflation. Also, governments often replaced private industry with state-owned enterprises, contributing to rising budget deficits.
To continue industrialization, countries needed imports of capital goods—machines and intermediary goods that could not be produced domestically. To pay for the capital and infrastructure needed to industrialize as well as fund rising government deficits, countries expanded the money supply and borrowed internationally.
International debt requires repayment. To repay, countries must run a trade surplus to generate sufficient foreign exchange for debt service. That is, they need to export more than they import to have foreign exchange left over for repayment. ISI policies, however, lead to the exact opposite situation. Rising costs of production and overvalued exchange rates made most nations’ exports uncompetitive internationally. When global economic conditions slowed following the oil crises, demand for exports fell even further. At a time when developing nations needed massive amounts of foreign exchange, their uncompetitive exports generated little. The end result of the ISI experiment was many heavily indebted countries facing a balance-of-payment crisis.
Nations facing shortages of foreign exchange have few options. With a growing balance-of-payment crisis, nations either had to borrow more foreign exchange for debt service or default on their loans. Defaulting was not an attractive option as it affects a nation’s ability to borrow in the future. Furthermore, there was tremendous international pressure from lending nations to ensure repayment. Borrowing was also problematic. The international banking community was unwilling to invest in more potential bad debt.
This void was filled by the IMF. The IMF was created in 1944 in Bretton Woods, New Hampshire, and one of its primary purposes is to provide temporary financial assistance to countries in need of balance-of-payment adjustment (www.imf.org). Assistance from the IMF was not without conditions. Borrowing countries were in the current predicament because they could not generate sufficient foreign exchange to repay international debt. IMF conditionality focused on restructuring the economy to generate more foreign exchange. The goal was to make exports more attractive (think cheaper) and imports more expensive. The Structural Adjustment Policy (SAP) era had begun.
Structural adjustment generally began with exchange rate rationalization. The struggling nations typically had fixed and overvalued exchange rates. The overvaluation was a result of inflation as well as other policy choices. With inflation, the average price of all goods, including exports, rises. As prices rise, the demand for a nation’s exports falls, resulting in a decline in the demand for their currency. At the same time, imports become relatively cheaper than domestic goods, leading to an increase in demand for imports and foreign exchange. The end result for the struggling nation is an increase in the supply of its currency in pursuit of imports and a fall in demand of its currency in response to declining demand for exports—the price of the currency should fall to return to equilibrium. With a fixed exchange rate, however, this adjustment does not take place. The IMF’s approach to overvalued exchange rates was twofold. First, nations needed to devalue their currency to more closely reflect market conditions. Second, they needed to address the source of overvaluation—inflation.
Much of the inflation of ISI nations was due to their prior policies—subsidizing industrialization, building infrastructure, and operating state-owned enterprises. From a macroeconomic perspective, government spending was generating demand push inflation. Reducing spending required cutting government budgets and privatizing state-owned enterprises—a policy-induced recession. The immediate effect was increased unemployment and poverty for the global majority, setting the stage for the fair trade movement.
Growth of Social Justice Movement
The second component leading to the rise of fair trade was the collapse of the International Coffee Agreement (ICA). Commodity markets have historically gone through boom and bust periods. Oversupply leads to price collapse, recessions lead to reduced demand and price collapse, and favorable conditions such as good weather and appropriate rainfall lead to a surge in output and price collapse. Variability in both supply and demand leave commodity producers in general and coffee producers in particular in a precarious position. In an effort to dampen the boom and bust cycles experienced by coffee producers, the ICA was ratified in 1962 (www.ico.org).
The ICA was negotiated under guidance of the United Nations. The agreement reached in 1962 established a series of quotas among coffee-producing nations to stabilize prices. The excess supply was removed from the marketplace and destroyed, primarily by national coffee boards. The ICA established a threshold target price for coffee. When demand for coffee was sufficiently high and the price increases above the threshold, the quotas were relaxed and producer earnings increased.
In 1986, Brazil experienced a prolonged drought that reduced Brazil’s output by 1.14 billion kilograms (U.S. Department of Agriculture [USDA], 1999). This massive contraction led to a price increase and the suspension of the quota by the ICA. Once prices returned to historical levels, it proved difficult to reinstate the quotas. Nations did not want to reduce their coffee exports and earnings, requiring prolonged negotiations to reintroduce the ICA. While the quotas were reinstated in the 1987 agreement, they were short-lived. By 1989, it became clear that price control though a quota system was unmanageable.
Part of the difficulty lay in the reliance on national coffee boards for verification and enforcement of the quota system. Most national coffee boards were either vastly underfunded or completely eliminated during the mandated structural adjustment cuts to government spending. With insufficient oversight and outright corruption, the flow of coffee was virtually unmanaged. Recognizing this, in 1989, the ICA shifted its focus away from price control toward market expansion and infrastructure development (www.ico.org/history.asp). The International Coffee Organization continues to promote coffee consumption and to provide practical support to the coffee community.
A second factor contributing to the collapse of the ICA was the fall of communism. The ICA was seen as a tool to promote Western ideology. The quota system as well as other forms of funding and aid led to higher incomes for rural farmers. Higher and more stable income was hoped to reduce the incentives for farmers to join radical movements, particularly communist and Marxist groups. With the end of the cold war, the West’s concern with leftist movements was reduced, and support for ratifying the ICA crumbled.
The rise of structural adjustment and the collapse of the international coffee agreement had a significant impact on coffee producers. The implementation of structural adjustment required governments to substantially cut spending. This resulted in rising unemployment and a reduction in social spending on health care, education, and other social programs. Furthermore, the move toward free trade and open economies led to a collapse of the industrial sectors in many developing countries. Free trade pushed countries to produce where there existed a natural comparative advantage, resulting in an expansion of traditional exports, typified by the movement into coffee production by many of the world’s poor. As coffee production began to expand, the collapse of the ICA removed price guarantees for coffee producers, resulting in falling incomes, subsistence farming, and highly precarious living.
This void was filled by civil society, principally social justice groups. Fair trade markets find their roots in more than 50 years of alternative trade relationships. Long before certification existed, churches, disaster relief organizations, and solidarity groups had formed more direct trade relationships with refugees and marginalized groups. The goal of these organizations was to get more income into the hands of poor producers around the world. They worked to increase market access for Third World producers by connecting directly with the producers and creating new distribution chains through religious and solidarity networks. This direct connection with producers resulted in better prices and increased market access. The solidarity groups were also able to provided technical assistance and improve access to education and health care. The impact of the solidarity movement was limited by the number of solidarity groups and small markets they had access to, resulting in a low volume of fairly traded goods. The ability to promote development and improve quality of life for poor producers was limited.
To increase the impact, fair trade groups had to tap into existing markets. Solidarity and church groups were effective in matching socially minded consumers directly to producers but lacked the scale to have a significant impact. A solution was introduced by Solidaridad, a Dutch alternative trade organization. Solidaridad created a label, Max Havelaar, which guaranteed that the goods carrying the label met specific labor and environmental standards. The label was initially applied only to coffee. Labeling moved socially minded consumers out of church halls and basements and into supermarkets and other retail centers. The label provided a signal of the direct connection to producers that in the past was provided by word of mouth in church and solidarity groups.

The labeling initiative caught on. Max Havelaar was soon joined by the Fairtrade Foundation, Transfair, and Rattvisemarkt. Initially, the fair trade organizations operated independently, but in 1997, they joined together to form the Fairtrade Labeling Organizations International (FLO). FLO works to standardize fair trade, support fair trade initiatives, and certify producers.
Fair Trade Standards
Fair trade labels ensure that certain standards are maintained by producers of fair trade products. Fair trade certifiers monitor producers to ensure that the standards are met. Remember that fair trade arose from the alternative trade movement. It is building a model that does not put profit maximization as the primary goal. Rather, the movement is focused on changing the relationship between producers and consumers. It hopes to raise awareness in consumers of the impact of their consumption on others, including the producers and the environment, while at the same time lifting poor producers out of poverty.
Below is a summary of fair trade principles (Clement & Defranceschi, 2006):
- Creating opportunities for economically disadvantaged producers. Fair trade is a strategy for poverty alleviation and sustainable development. Its purpose is to create opportunities for producers who have been economically disadvantaged or marginalized by the conventional trading system.
- Transparency and accountability. Fair trade involves transparent management and commercial relations to deal fairly and respectfully with trading partners.
- Capacity building. Fair trade is a means to develop producers’ independence. Fair trade relationships provide continuity, allowing producers and their marketing organizations to improve their management skills and gain access to new markets.
- Payment of a fair price. A fair price in the regional or local context is one that has been agreed through dialogue and participation. It covers the costs of production and enables socially just and environmentally sound production. It promotes gender equity and equal pay for equal work by women and men. Fair trade ensures prompt payment and, when possible, provides credit for producers.
- Working conditions. Fair trade promotes a safe and healthy working environment for producers. The participation of children (if any) must not adversely affect their well-being, education, or need for play and conforms to the UN Convention on the Rights of the Child as well as the law and norms in the local context.
- The environment. Fair trade actively encourages better environmental practices and the application of responsible methods of production.
In the context of coffee, fair trade focuses on small-scale producers, generally family-owned farms. A driving goal of fair trade is to reduce poverty. Therefore, only small-scale producers are eligible for certification, excluding plantation production schemes. Wholesale purchasers of fair trade coffee have minimum buying requirements; therefore, small producers must band together and form cooperatives. By pooling their output, cooperatives can attain economies of scale in production and sales. Fair trade coffee cooperatives also promote community involvement and can fund community-level projects such as the construction of roads or medical centers.
To use fair trade labeling, wholesalers must buy directly from approved grower organizations using purchasing agreements that extend beyond one harvest cycle. Wholesalers must also pay the FLO minimum price (U.S.$1.21 per pound for Arabica coffee), pay an additional $.15 per pound for coffee certified organic, and pay a social premium of $.05 per pound. To ease credit constraints, purchasers must also offer financing equal to 60% of the contract value. This arrangement creates long-term partnerships between producers and wholesalers and encourages growers to invest in infrastructure. It also allows for more direct access to markets and prevents predatory practices where buyers prebuy coffee harvests at low prices from desperate farmers.
Theory
There is no single theoretical framework to model fair trade. Three strands of theory will be explored that can be used to better understand fair trade. First is a discussion of demand for fair trade coffee based on utility and consumer choice. This is followed with a discussion of the supply decision for fair trade coffee growers. Finally, fair trade is presented in the framework of market failures and global value chains in coffee production.
Standard economic modeling describes the problem of consumer choice as one of utility maximization. Rational agents will spend each dollar to provide the greatest amount of utility possible. The maximizing agent will be in equilibrium when the marginal utility divided by the price is equal across goods. In this light, the purchase of fair trade coffee would be difficult to justify as it is providing the same consumption experience at a higher price.
Consider two goods: good x (say, coffee) and good y, a bundle of all other goods. For a given level of income, consumers aim to maximize their utility subject to their budget constraint, as shown in Figure 49.2. For given income and prices, consumers will buy the last bundle of goods affordable—where the indifference curve is just tangent to the budget line (BL1). This is shown at point A in Figure 49.2. Now consider the move to fair trade coffee. Because fair trade coffee is more expensive than conventional coffee, the budget line rotates to BL2—the same income now buys less. Indifference curve 1 (IC1) is no longer affordable, and the consumer moves to a lower level of total utility (IC2), a seemingly irrational choice.
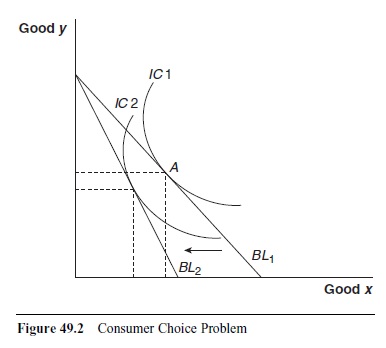 Figure 49.2 Consumer Choice Problem
If, however, we broaden our notion of utility, the purchase of fair trade is rational. First, consider decision utility as the satisfaction derived from the outcome itself. Given a choice between A and B, if A is chosen, then A has been revealed as preferred over B. On the other hand, diagnostic utility refers to the utility that an individual gains from his or her actions. So for example, the choice to donate to a worthy cause may increase self-esteem and provide additional utility. The total utility received is the sum of the decision utility and the diagnostic utility. Losses in decision utility due to overpaying for a good or experience can be offset by the increase in diagnostic utility by participating in what is viewed as a worthy cause. Consumers of fair trade coffee receive utility from the consumption of the coffee itself and the satisfaction of participating in a worthy cause.
Now consider the coffee supply decision. Coffee producers must decide on whether to participate in fair trade coffee production. As discussed above, fair trade standards set a minimum price for coffee. This creates a price floor (p) and excess supply. As shown in Figure 49.3, the fair trade price is above the equilibrium price (PE), and supply (Q2) exceeds demand
The higher price guaranteed by fair trade creates an incentive to increase production beyond the market clearing quantity. Because fair trade is a relatively small share of the total coffee market, many coffee farmers can sell only a portion of their output as fair trade, with the remainder spilling into the conventional market and sold at prevailing prices.
Fair trade, however, raises production costs in complying with certification standards. Coffee producers therefore must make a decision on the expected profits from fair trade production based on their costs and expected demand. As long the total premium earned for the volume of coffee sold in the fair trade market exceeds the extra costs of production, there is an incentive to produce fair trade. With weak demand for fair trade, excess production is sold in the conventional market, often at prices below cost, leading to losses for farmers. Therefore, fair trade producers still face income uncertainty.
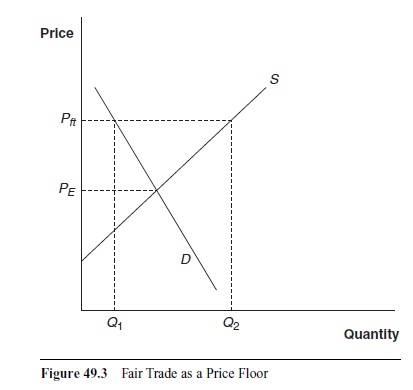 Figure 49.3 Fair Trade as a Price Floor
An alternate way to think about fair trade is in relation to market failures, specifically uncompetitive markets. Value chain analysis looks at how profits are distributed along the way from ripe fruit to coffee in the cup. As coffee moves through the distribution chain from grower to consumer, it passes through several hands and is transformed in some manner at each stage. If markets are competitive, each stage of production will receive profits equal to the value added at their respective stage. However, when markets are not competitive, individuals or firms can use their market power to extract surplus value at the expense of someone else along the value chain.
Talbot (1997) provides an instructive analysis of the coffee production chain. He divides the process into three main components: growing/initial processing on the farm, processing up to the green coffee stage and exporting, and importing green coffee/final processing and sale of roasted or instant coffee to consumers.
Talbot (1997) calculates the share of the total sale price of a pound of ground roasted coffee that accrues along the various stages of the value chain from 1971 to 1995. This includes several periods of booms and busts in the coffee market, most notably the Brazil frost of 1975 that devastated the 1976 coffee crop. His results indicate that the share of the per pound price of ground roasted coffee going to the grower has been falling from an average of 21.4% in the 1970s to 19.5% in the 1980s and 13.3% in the 1990s. Moreover, over the time frame Talbot analyzed, the retail price of coffee rose in 13 years, but the price paid to the growers in dollar terms fell in 5 of those 13 years. A driving force in the decline of income paid to coffee growers from the mid-1980s was the unraveling of the International Coffee Agreement in 1986.
The breakdown of the ICA allowed a handful of multinational corporations to effectively hold down the price of green coffee beans and raise the price of processed coffee in consuming countries. By controlling green coffee exports, companies such as Kraft, Nestlé, Procter & Gamble, Sara Lee, and Tchibo can use their market power to keep prices low. Historically, coffee producers have had little access to markets and pricing information and no distribution channel, leaving them at the mercy of large multinational vendors.
Fair trade attempts to address this market failure. While fair trade mandates a minimum price for growers, it also creates more direct distribution between consumers and producers. The elimination of several layers in the distribution chain raises grower earnings. Furthermore, the social premium allows communities to invest in infrastructure, reducing production costs and strengthening direct market contact. Pooling coffee growers into cooperatives creates economies of scale and increases bargaining power.
Value chain analysis convinced many that markets are biased against the world’s poor. Structural adjustment policies and later actions by the World Trade Organization created a market backlash and brought attention to alternate trade arrangements. The arrival of fair trade became an important market-based pro-poor initiative. The popular mantra of “trade, not aid” signifies that fair trade is not a handout but a trade alternative that promotes respect and dignity as it works to alleviate poverty.
Evidence
While fair trade advocacy groups provide anecdotal evidence highlighting the success of fair trade, there is limited research into the relative effectiveness of fair trade in achieving its goals. In a seminal paper, Raynolds, Murray, and Taylor (2004) consider the gains of fair trade coffee to producers, cooperatives, and communities. They analyzed seven fair trade coffee cooperatives: five in Mexico, one in Guatemala, and one in El Salvador. They report that households in the cooperatives have higher and more stable income. Fair trade participation generated two to three times the earnings of conventional sales for households. The authors suggest that while many conventional producers were forced to migrate to cities when coffee prices fell below production costs, fair trade members were able to stay on their land. Furthermore, they were able to use the premium from fair trade to invest in safe water and education. The premium also allowed diversification of farm activities, enhancing income and security.
Cooperatives also provide benefits to their members. Part of the fair trade premium was used by cooperatives to build infrastructure, increase storage capacity, and invest in processing plants. This increases local processing, lowers transportation costs, and enhances profits for members. Cooperatives have also used a portion of the fair trade premium to provide medical services to the community and frequently provide additional social benefits such as education, housing, and even stores selling low-priced necessities.
Bacon, Ernesto Mendez, Eugenia Flores, and Brown (2008) conducted a household-level survey on 177 coffee-producing households in northern Nicaragua. The sample contained 101 households that are part of a fair trade cooperative, 61 that sell in conventional markets, and 15 that sell certified organic coffee. Their results are framed within the United Nations Millennium Development Goals, of which only two will be discussed.
They estimate that the average household profits from the production of coffee were about $971 per year. Based on average household size, this corresponds to about $0.38 per person per day, well below the United Nation threshold for extreme poverty of $1. Furthermore, there was no significant earnings difference between fair trade, conventional, or organic producers. Income from coffee sales, whether fair trade or conventional, was insufficient to eradicate extreme poverty in this sample, with 69% of the households reporting they were sometimes unable to meet basic nutritional needs.
There were, however, significant educational differences between fair trade and conventional households. Fair trade households sent 97% of 7- to 12-year-olds to primary school, above the rate for conventional coffee households (74%) and the national average (88%). The difference continued into secondary school, where 84% of 13- to 17-year-olds in fair trade households were attending compared to 53% from conventional households.
Overall, the results from Bacon et al.’s (2008) research are mixed. While it appears that participation in fair trade led to a greater commitment to education, there were no significant differences in earnings associated with fair trade production. Further income generated from any type of coffee production was insufficient to lift households out of extreme poverty and resulted in food insecurity.
In a noncoffee study, Becchetti and Costantino (2008) consider the impact of fair trade on herb growers in Kenya. They focus on Meru Herbs, a commercial organization created in 1991 by an association of local farmers as a means to fund canals on the Kitheno River. Roughly 97% of Meru Herbs sales are from fair trade exports of both organic and conventional products. Meru Herbs signs contracts with farmers who either have organic certification or are in the process of obtaining it. The farmers agree to sell some of their produce to Meru Herbs and in exchange receive complimentary seeds, organic fertilizer, low-cost fruit trees, training courses, and technical assistance. Meru Herbs also buys fruit from conventional farmers with no additional benefits provided.
The authors conducted a survey and divided the respondents into four distinct groups: organic producers, conversion producers, fruit-only producers, and a control group. The organic producers are certified and have a signed contract with Meru Herbs. Conversion producers have signed a contract but have not completed the conversion to organic production. Fruit-only producers do not have a contract but sell fruit to Meru. The control group consists of farmers from the same region who have access to the canal project but no connection to fair trade outlets. The benefits of fair trade are measured using income, health, child labor, and education.
The groups affiliated with fair trade all reported higher income than the control group. The premium for fair trade ranged from 65% for conversion producers to 38% for fruit-only producers. It is interesting that the conversion producers have higher monthly earnings than established organic producers. One explanation may be that a premium is paid to lure the producers to convert to organic. It may also be that only the best nonorganic producers are given contracts, creating potential selection biases.
The results from the health measures are less clear. Groups affiliated with fair trade reported lower child mortality rates than the control group, with child mortality rates ranging 42% to 75% lower. There was virtually no difference in child vaccination rates between fair trade and the control group. Furthermore, while organic and conversion farmers were more likely to have their last child born in a hospital, the fruit-only and control groups were equally likely at 60%.
Moving to child labor and education, we again see mixed results. The authors measure child labor based on the percentage of children attending school. The control group reported that on average, 23% of household children between the ages of 6 and 15 were attending school, while 19% of teens between 15 and 18 were attending school. This is better than organic producers (13% and 9%, respectively) and fruit-only producers (8% and 4%, respectively). Only conversion producers reported higher rates than the control group (45% and 25%). This may provide further support for selection bias among those who convert from traditional to organic production.
These results support the notion that fair trade raises income, with fair trade-affiliated producers receiving on average 53% more in monthly earnings than the control group. The impact on health, child labor, and education is less clear. The control group reports higher child mortality rates than fair trade producers but lower levels of child labor and greater commitment to education than two of the fair trade groups.
Future Directions
It is clear that fair trade has stirred great interest and passion among citizens of developed countries as a method to improve well-being among impoverished producers. The question remains as to whether fair trade can achieve this goal. Empirical results to date have been mixed, and more research needs to be done to understand the impact of fair trade on producers. The focus needs to expand beyond income and look at broader issues such as vulnerability and security to see if fair trade has the capacity to improve well-being.
A promising avenue for fair trade to explore is boutique coffee. Increasing quality standards may lead to appreciable taste differences between fair trade and conventional coffee, increasing demand. There is also some evidence that producers gain from direct market access, but more needs to be done in this area as well. Marketing and distributing coffee requires expertise and generates additional costs. Distributors must have sufficient resources to finance coffee transactions. If indeed direct market access promotes farmers’ earnings, then investment in infrastructure and outreach will expand the connection between producers and consumers.
Conclusion
Fair trade is a market-based pro-poor trade alternative that offers trade, not aid. It arose from the backdrop of structural adjustment eliminating many social programs for the world’s poor and the collapse of the International Coffee Agreement. The outcome of several social justice campaigns, fair trade promises higher and more stable income, sustainable development, and respect and dignity for working poor people around the world. Consumers participate in fair trade to express their preferences for social justice and solidarity for producers. Coffee growers incur higher costs to produce in accordance with fair trade standards and do so to generate higher earnings. With historical market failures in coffee production due to the market power of multinational coffee vendors, fair trade is a way of breaking down barriers between producers and consumers, allowing direct distribution of coffee. The impact of fair trade on well-being is mixed. Some results suggest that fair trade leads to higher earnings, while others indicate no significant difference in earnings for fair trade and conventional producers.
See also:
Bibliography:
- Bacon, C. (2005). Confronting the coffee crisis: Can fair trade, organic, and specialty coffees reduce small-scale farmer vulnerability in northern Nicaragua? World Development, 33, 497-511.
- Bacon, C., Ernesto Mendez, V, Eugenia Flores, M., & Brown, M. (2008). Will “we” achieve the millennium development goals with small-scale coffee growers and their cooperatives? A case study evaluating fair trade and organic coffee networks in northern Nicaragua. Santa Cruz: University of California, Santa Cruz, Center for Agroecology & Sustainable Food Systems Research Briefs.
- Barratt Brown, M. (1993). Fair trade: Reform and realities in the international trading system. London: Zed Books.
- Becchetti, L., & Adriani F. (2002). Fair trade: A “third generation welfare” mechanism to make globalisation sustainable (Working Paper 170). Rome: University of Rome Tor Vergata, Centre for International Studies on Economic Growth.
- Becchetti, L., & Costantino, M. (2008). The effects of fair trade on affiliated producers: An impact analysis on Kenyan farmers. World Development, 36, 823-842.
- Bodner, R., & Prelec, D. (1997). The diagnostic value of actions in a self-signaling model. Retrieved from http://www.cepr.org/ meets/wkcn/3/3503/Papers/Prelec.pdf
- Clement, S., & Defranceschi, P. (2006). BUY FAIR: A guide to the public purchasing of fair trade products. Toronto, Ontario, Canada: ICLEI—Local Governments for Sustainability.
- Fridell, G. (2004). The fair trade network in historical perspective. Canadian Journal of Development Studies, 25, 411-428.
- Jaffee, D. (2007). Brewing justice: Fair trade coffee, sustainability and survival. Berkeley: University of California Press.
- LeClair, M. (2002). Fighting the tide: Alternative trade organizations in the era of global free trade. World Development, 30, 949-958.
- Maseland, R., & de Vaal, A. (2002). How fair is fair trade? De Economist, 150, 251-272.
- Murray, D., Raynolds, L. T., & Taylor, P. L. (2003). One cup at a time: Fair trade and poverty alleviation in Latin America. Retrieved August 8, 2008, from http://www.colostate .edu/Depts/Sociology/FairTradeResearchGroup
- Murray, D., Raynolds, L. T., & Taylor, P. L. (2004). Building producer capacity via global networks. Journal of International Development, 16, 1109-1121.
- Ponte, S. (2002). The ”Latte Revolution”? Regulation, markets and consumption in the global coffee chain. World Development, 30, 1099-1122.
- Prebisch, R. (1971). Change and development: Latin America’s great task; report submitted to the Inter-American Development Bank. New York: Praeger.
- Raynolds, L. (2002). Poverty alleviation through participation in fair trade coffee networks: Existing research and critical issues. Background paper prepared for project funded by the Community and Resource Development Program, the Ford Foundation, New York. Retrieved August 8, 2008, from http://www.colostate.edu/Depts/Sociology/FairTradeResearch Group
- Raynolds, L., Murray, D., & Taylor, P. (2004). Fair trade coffee: Building producer capacity via global networks. Journal of International Development, 16, 1109-1121.
- Renard, M. (1999). The interstices of globalisation: The example of fair coffee. Sociologia Ruralis, 39, 484-500.
- Simpson, C., & Rapone, A. (2000). Community development from the ground up: Social-justice coffee. Human Ecology Review, 7, 46-57.
- Steinrucken, T., & Jaenichen, S. (2006). Does the fair trade concept work? An economic analysis of social labels. Aussenwirtshaft, 61, 189-209.
- Talbot, J. (1997). Where does your coffee dollar go? The division of income and surplus along the coffee commodity chain. Studies in Comparative International Development, 32, 56-91.
- S. Department of Agriculture (USDA). (1999). Agricultural outlook. Available at http://www.ers.usda.gov/publications
- Waridel, L. (2002). Coffee with pleasure: Just java and world Montreal, Quebec, Canada: Black Rose Books.
- Weber, J. (2007). Fair trade coffee enthusiasts should confront reality. Cato Journal, 27, 109-117.
- Wrigley, G. (1988). Coffee. London: Longman. Yanchus, D., & de Vanssay, X. (2003). The myth of fair prices: A graphical analysis. Journal of Economic Education, 34, 235-240.
- Zadek, S., & Tiffen, P. (1996). Fair trade: Business or campaign? Development, 3, 48-53.
Free research papers are not written to satisfy your specific instructions. You can use our professional writing services to buy a custom research paper on any topic and get your high quality paper at affordable price.
ORDER HIGH QUALITY CUSTOM PAPER

Always on-time

Plagiarism-Free

100% Confidentiality
