
This sample Curriculum-Based Assessment Research Paper is published for educational and informational purposes only. Like other free research paper examples, it is not a custom research paper. If you need help writing your assignment, please use our custom writing services and buy a paper on any of the education research paper topics.
Monitoring student progress is an important form of classroom assessment. Teachers use progress monitoring for two purposes. The first purpose is to determine whether a student’s academic development within an academic year is proceeding well. Second, when a student is not progressing adequately, teachers use progress monitoring to design an individualized instructional program that promotes better academic growth. The form of progress monitoring with the strongest scientific evidentiary base is curriculum-based measurement. A large body of research shows that curriculum-based measurement produces accurate descriptions of student development in reading and math. Moreover, formal school-based experiments (where teachers are randomly assigned to plan instruction with and without curriculum-based measurement) demonstrate that when teachers use curriculum-based measurement to inform their instructional decision making, their students achieve better. Curriculum-based measurement is therefore relevant to discussions about education in the 21st century, when the focus on improving student outcomes dominates education reform. In this research-paper, we briefly explain the conventional approach to progress monitoring, known as mastery measurement. Then, we introduce best practice in progress monitoring, in the form of curriculum-based measurement. We explain how curriculum-based measurement differs from mastery measurement and provide an overview of curriculum-based measurement. Then we describe curriculum-based measurement in reading and in math; we explain guidelines for using curriculum-based measurement to make instructional decisions; we note how computer applications are designed to make curriculum-based measurement easier for teachers to use; and we explain how progress monitoring generally and curriculum-based measurement in particular are an important component in the education reform known as responsiveness to intervention. Finally, we discuss future directions and provide a summary of this research-paper.
Mastery Measurement: The Conventional Approach to Progress Monitoring
Thirty years ago, the dominant approach to progress monitoring was mastery measurement. With mastery measurement, the teacher specifies a hierarchy of instructional objectives that constitute the annual curriculum. For each objective in the sequence, the teacher devises a test. The goal is to use this test to assess student mastery of the skill. When a student achieves mastery, the teacher simultaneously shifts instruction and assessment to the next skill in the hierarchy. In this way, learning is conceptualized as a series of short-term accomplishments that are believed to accumulate into broader competence. This form of progress monitoring is reflected in most basal reading and math programs. Also, years ago, it was popularized with the Wisconsin Instructional Design System (see http://www.wids.org) and Precision Teaching (e.g., http://www.celeration.org).
At about that same time, Stanley Deno at the University of Minnesota launched a systematic program of research on the technical features, logistical challenges, and instructional effectiveness of progress monitoring. The initial focus of that research program was mastery measurement, but several technical difficulties associated with mastery measurement quickly emerged. For example, to assess mastery of a specific skill, each item on a mastery measurement test addresses the same skill. Unfortunately, such testing is potentially misleading because many low achievers can, for example, read consonant-vowel-consonant words (like cat, dog, fun) if they know that all the words on the test conform to that same phonics pattern. Similarly, some low achievers can solve addition with regrouping problems if they know to regroup for all problems on the test. By contrast, when a text mixes words with different phonetic patterns or a test mixes math problems of different types (as occurs in the real world and on high-stakes tests), these same students no longer perform the mastered skill competently. This questions mastery measurement’s assumption that mastery of a series of short-term accomplishments accumulates into broad-based competence. It also means that students who have mastered a lot of objectives during the school year may not be able to use their knowledge in flexible ways or score well on the state tests at the end of the year. So, mastery measurement can lull educators into a false sense that their students are making progress.
Best Practice in Progress Monitoring: Curriculum-Based Measurement
How Curriculum-Based measurement Differs From mastery measurement
To address this and other important problems associated with mastery measurement, Deno (1985) conceptualized an alternative approach to progress monitoring now known as curriculum-based measurement. Each weekly curriculum-based measurement is an alternate form, representing the many skills and strategies that the teacher expects students to be competent with at the end of the year. In this way, curriculum-based measurement circumvents mastery measurement’s technical difficulties because curriculum-based measurement requires students to simultaneously integrate, on every weekly test, the various skills required for competent year-end performance. As students learn the necessary components of the annual curriculum, their curriculum-based measurement score gradually increases. Also, because each weekly test is comparable in difficulty and conceptualization, the average increase per week in the curriculum-based measurement scores (called slope) can be used to quantify a student’s rate of learning. Educators use slope to gauge a student’s responsiveness to the instructional program and to signal the teacher if the student’s instructional program is not working well and needs to be modified. Curriculum-based measurement therefore differs from mastery measurement in two major ways (see Fuchs & Deno, 1991, for a discussion). First, curriculum-based measurement’s focus is long-term so that testing methods and content remain constant, with equivalent weekly tests spanning the school year. Second, curriculum-based measurement is standardized so that the behaviors to be measured and the procedures for measuring those behaviors are prescribed, and those prescribed procedures have been documented to be accurate and meaningful (i.e., to be reliable and valid).
To illustrate how curriculum-based measurement is used, let’s say that a teacher establishes a reading goal for year-end performance as competent second-grade performance. Then, relying on established methods, the teacher identifies enough passages of equivalent, second-grade difficulty to provide weekly assessments across the school year. Each week, the teacher (or aide) has the student read aloud from a different passage for 1 minute; the score is the number of words read correctly. Each simple, brief assessment produces an indicator of overall reading competence because it requires a multifaceted performance. This performance entails, for example, a reader’s skill at automatically translating letters into coherent sound representations, unitizing those sound components into recognizable wholes and automatically accessing lexical representations, processing meaningful connections within and between sentences, relating text meaning to prior information, and making inferences to supply missing information. As competent readers translate text into spoken language, they coordinate these skills in a seemingly effortless manner (Fuchs, Fuchs, Hosp, & Jenkins, 2001).
Because the curriculum-based measurement passage-reading fluency task reflects this complex performance, it can be used to characterize overall reading expertise and to track its development in the primary grades. That is, it serves as an overall indicator of reading competence. Alternatively, curriculum-based measurement can be structured so that instead of assessing one behavior that serves as an overall indicator of academic competence, like passage-reading fluency, it systematically samples the various skills that constitute the annual curriculum. With curricular sampling, the weekly curriculum-based measurement test presents the student with items that represent the variety of skills the teacher will address over the course of the academic year.
With either approach, each progress-monitoring test collected across the school year is of equivalent difficulty. For that reason, the scores can be graphed and directly compared to each other. Moreover, a slope (i.e., average increase per week) can be calculated on the series of scores to quantify the rate of improvement. This strategy for characterizing growth is more sensitive to individual differences than those offered by other classroom assessments. In addition, curriculum-based measurement is sensitive to growth made under a variety of treatments. In a related way, teachers’ instructional plans developed in response to curriculum-based measurement incorporate a wide range of instructional methods. For example, in reading, instructional plans developed in response to curriculum-based measurement incorporate decoding instruction, repeated readings, vocabulary instruction, story grammar exercises, and semantic-mapping activities. So, curriculum-based measurement is not tied to any particular instructional approach.
Perhaps most important, however, studies indicate that curriculum-based measurement progress monitoring enhances teachers’ capacity to plan programs for and affect achievement among students with serious learning problems. The methods by which curriculum-based measurement informs instructional planning rely on the graphed scores. If a student’s rate of improvement is judged to be inadequate, the teacher revises the instructional program. Research (see Fuchs & Fuchs, 1998, for summary) shows that with curriculum-based measurement decision rules, teachers design more varied instructional programs that are more responsive to individual needs, that incorporate more ambitious student goals, and that result in stronger end-of-year scores on standardized reading tests, including high-stakes state tests. In addition, when curriculum-based measurement is designed to systematically sample the skills embedded in the annual curriculum, performance on the individual skills represented on each assessment can be analyzed. This kind of skills analysis enhances the quality of instructional programming.
Curriculum-Based Measurement Measures in Reading
As already stated, curriculum-based measurement can take one of two forms. It can rely on a single behavior that functions as an overall indicator of competence in an academic area or it can systematically sample the annual curriculum. In reading, most well-researched curriculum-based measurement systems take the overall indicator approach.
Kindergarten
At kindergarten, the major alternatives for curriculum-based measurement reading measures are phoneme segmentation fluency, rapid letter-naming, and letter-sound fluency. With phoneme segmentation fluency, the examiner says a word and the student says the sounds that make up the word (i.e., the tester says, cat; the child says, /c//a/ /t/). The examiner provides as many test items within 1 minute as the rate of the child’s response permits. With rapid letter-naming, the examiner presents a page of lowercase and uppercase letters randomly ordered; then the student says as many letter names as he or she can in 1 minute. With letter-sound fluency, the examiner also presents a page with lowercase and uppercase letters randomly ordered; this time, however, the student says sounds for 1 minute. Compared to phoneme segmentation fluency, rapid letter-naming and letter-sound fluency are easier for teachers to learn to administer, and reliability tends to be stronger. On the other hand, compared to rapid letter-naming, phoneme segmentation fluency and letter-sound fluency are better targets for instruction because they relate more transparently to what children need to learn to read. For this reason, phoneme segmentation fluency and lettersound fluency may guide the kindergarten teacher’s instructional behavior more effectively, but such studies to confirm this have not been conducted.
First Grade
At first grade, two curriculum-based measurement reading measures have been studied. One approach involves combining nonsense word fluency and passage-reading fluency. Students begin the year on nonsense word fluency and move to the more difficult performance indicator, passage-reading fluency, in January. With nonsense word fluency, students are presented with a page of consonant-vowel-consonant pseudowords (like bav or guj) and have 1 minute to decode as many as they can. With passage-reading fluency, students are presented with first-grade text (each alternate form is a passage of roughly equivalent difficulty), and students read aloud for 1 minute. Alternatively, schools use a constant measure across all of first grade: word identification fluency, where students are presented with a page showing 50 high-frequency words (each alternate form samples words from a list of 100 words and presents the 50 in random order). Students read as many words as possible in 1 minute. The advantage of nonsense word fluency is that it maps onto beginning decoding instruction, potentially providing teachers with input for instructional planning. The downside of the nonsense word fluency/passage-reading fluency combination is that modeling student development over the course of first grade is not possible because the measure changes midyear. By contrast, word identification fluency can be used with strong reliability, validity, and instructional utility across the entire first-grade year. This also makes it possible to model the development of reading skill across the entire time frame. In addition, in a study that contrasted nonsense word fluency to word identification fluency (Fuchs, Fuchs, & Compton, 2004), the technical features of word identification fluency substantially exceeded those of nonsense word fluency.
Grades 2-6
At Grades 2 and 3, the curriculum-based measurement passage-reading fluency measure provides the strongest source of information on reading development. Each week one test is administered, with the student reading aloud from a different passage for 1 minute; the examiner counts the number of words read correctly within the 1-minute time frame. The accuracy (reliability), meaningfulness (validity), and instructional usefulness of this simple measure have been demonstrated repeatedly (see Fuchs & Fuchs, 1998, for summary). At Grades 4 through 6, however, as students move from learning to read to reading to learn, some studies suggest that the validity of the curriculum-based measurement passage-reading fluency task begins to decrease (Espin, 2006). This suggests that use of a different measure that more directly taps comprehension may be warranted beginning at Grade 4 or 5. One alternative for the higher grades, which is efficient for teachers to use on a regular basis, is curriculum-based measurement maze fluency. With maze fluency, students are presented with a passage from which every seventh word has been deleted and replaced with three word choices, only one of which makes sense in the blank. The student has 2 or 3 minutes to read and restore meaning to the passage by replacing blanks with words. The score is the number of correct replacements. Espin (2006) provided evidence that maze fluency demonstrates strong accuracy (reliability) and meaningfulness (validity) and models reading development well beginning at fourth grade and continuing through eighth grade.
Curriculum-Based measurement measures in math
Although most reading curriculum-based measurement systems rely on the overall indicator approach to model the development of competence, some math curriculum-based measurement systems rely on the overall indicator of competence whereas others rely on systematic sampling of the annual curriculum.
Kindergarten
At kindergarten, research has focused primarily on an overall indicator approach to curriculum-based measurement in math. The most promising measures are quantity discrimination (where students are presented with a page that shows pairs of numerals and have 1 minute to circle the larger quantity for each pair); number identification (where students are shown a page of numerals and have 1 minute to name the numbers); and missing number (where students are presented with strings of numerals, with the last numeral missing, and have 1 minute to fill in the missing numerals). Some forms of validity have been shown to be strong (e.g., Baker et al., 2002; Lembke & Foegen, 2006). Yet some work suggests that when these measures are used for progress monitoring, students may learn these specific tasks and reach the top score on the test within a month or two (Lembke & Foegen, 2006). To address this problem, Seethaler and Fuchs (2006) developed and are assessing a curriculum-sampling curriculum-based measurement approach at kindergarten, where a variety of computation and concepts or applications are systematically sampled on each alternate form. That study, which is under way, is assessing how well the curriculum-sampling curriculum-based measurement system, used at the beginning of kindergarten, forecasts students’ development of math competence at the end of first grade. At the present time, it is unclear which curriculum-based measurement measure is sound for monitoring math progress at kindergarten.
Grades 1-6
Most progress-monitoring research in math at first grade parallels the work conducted at kindergarten using quantity discrimination, number identification, and missing number. As with kindergarten, although some forms of validity look strong, the threat of students reaching the top score on the test quickly looms larger at first grade than at kindergarten. Alternatively, a curriculum-sampling curriculum-based measurement approach at first grade has been shown to index progress effectively and to forecast the development of serious math difficulties at the end of second grade (Compton, Fuchs, & Fuchs, 2006; Fuchs et al., 2005). In a similar way, work at Grades 2 through 6 (Deno, Jiban, & Spanjers, 2006) demonstrates the validity of a curriculum-sampling curriculum-based measurement approach, and other research (see Fuchs & Fuchs, 1998) illustrates how teachers can use the curriculum-sampling curriculum-based measurement approach in math to design more effective instructional programs.
Guidelines for using Curriculum-Based measurement to make Instructional Decisions
Regardless of which approach to curriculum-based measurement is used (overall indicator versus curriculum sampling), decision rules help teachers employ curriculum-based measurement for two purposes: (1) to determine whether a student’s academic development within an academic year is proceeding well, and (2) when a student is not progressing adequately, to design an individualized instructional program that promotes academic growth.

For determining whether a student’s academic development within an academic year is proceeding well, the teacher periodically considers the student’s rate of improvement (i.e., slope) against the rate of improvement demonstrated by other students in the class and by national norms for expected rate of improvement. Figure 49.1a is a sample curriculum-based measurement report for one class, as shown on page 455. This composite graph depicts the progress of students in the bottom 25% of the class, stu-dents in the middle 50% of the class, and students in the top 25% of the class. Under this class graph, students are identified as “students to watch” or “most improved” (within the past month). Then, based on their overall passage-reading fluency curriculum-based measurement score, students are sorted into groups requiring instruction on comprehension, fluency, or decoding (and if decoding, which type of phonetic pattern warrants attention). In Figure 49.1b (on page 456) each student’s instruction designation is presented; In Figure 49.1c (on page 457) the students’ slopes of improvement are shown. Figure 49.1d (on page 457) is designed to bring to the teacher’s attention those students who are noticeably behind their classroom peers in their current curriculum-based measurement score and their slope of improvement.
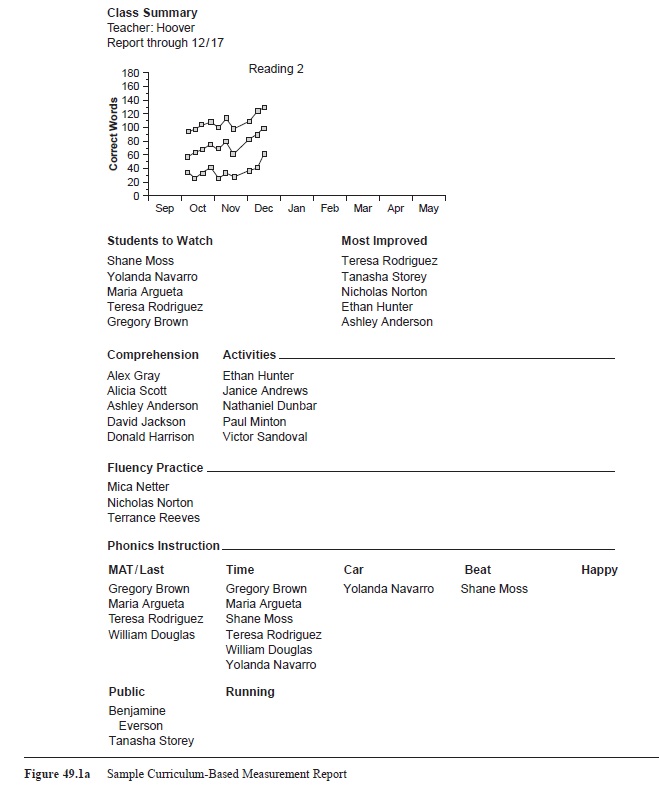 Figure 49.1a Sample Curriculum-Based Measurement Report
When a student is chronically identified as not making good progress (as shown in Figure 49.1d on page 457), curriculum-based measurement is then used to design an individualized instructional program that promotes academic growth. This is usually done by the special educator or the reading or math specialist (see Fuchs & Fuchs, 1998, for summary of research). For helping practitioners plan effective instruction, decision rules are tied to the slope (i.e., rate of improvement) on the graphed scores in conjunction with the goal set for year-end performance. Once the year-end goal is set, it is placed onto the student’s individual graph. A straight line connects the student’s initial several scores with that goal. This line is called the goal line. This goal line is compared to the student’s actual rate of improvement (i.e., a trend line representing the student’s slope). When a student’s trend line is flatter than the goal line, the teacher revises the instructional program in some important way in an attempt to effect better slope of improvement. After several weeks of implementing this instructional revision, the teacher analyzes the student’s graph in the same way, comparing the goal line against the student’s new trend line. If progress looks strong enough to realize the end-of-year goal, the program revision is considered successful (although data analysis continues to ensure strong improvement across the school year). If, however, progress looks inadequate to realize the end-of-year goal, then the teacher experiments with a different method for revising the instructional program. Research (see Fuchs & Fuchs, 1998) shows that this kind of data-based decision making used in conjunction with curriculum-based measurement produces more varied instructional programs, which are more responsive to individual needs, which result in more ambitious student goals, and which produce stronger end-of-year scores on commercial, standardized achievement tests including high-stakes state tests.
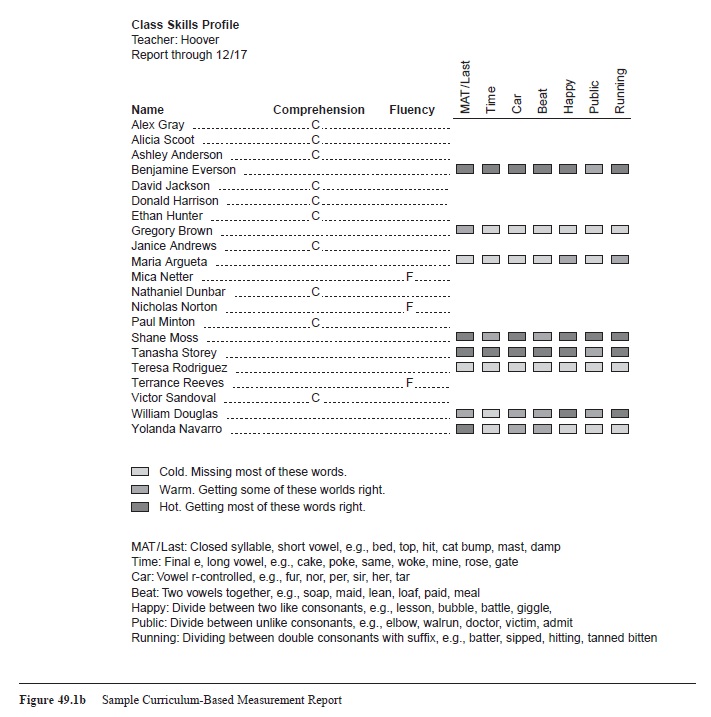 Figure 49.1b Sample Curriculum-Based Measurement Report
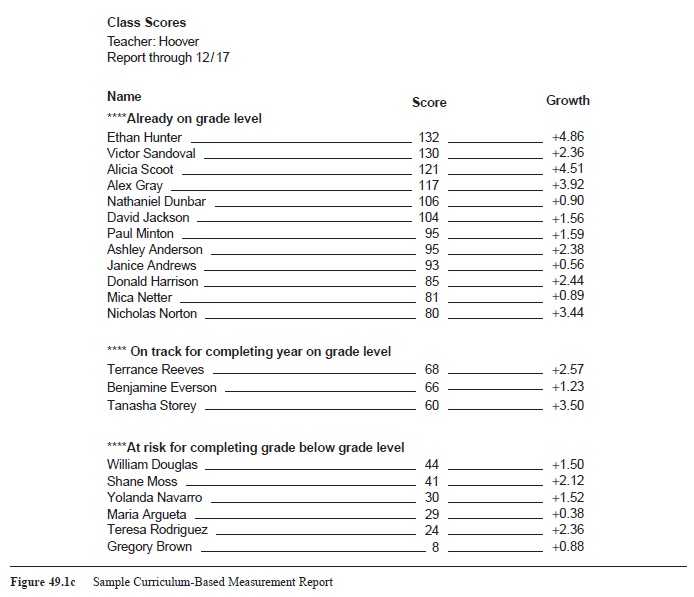 Figure 49.1c Sample Curriculum-Based Measurement Report
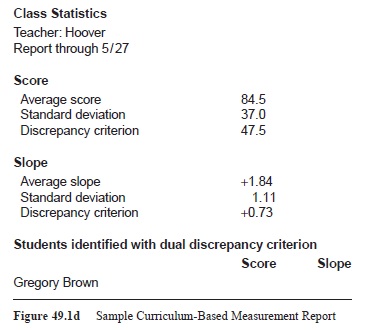 Figure 49.1d Sample Curriculum-Based Measurement Report
Computer Applications
With curriculum-based measurement, teachers administer tests according to standardized procedures, graph the resulting scores, and apply prescribed rules to the graphed scores to optimize decision making. Conducting these progress-monitoring curriculum-based measurement activities requires some training and experience, which may involve attending workshops and implementing progress monitoring with the guidance of experienced colleagues. At the same time, we note that over the past 20 years, computer applications have become available. These programs 0a.r5e designe+d0t.o3 0ease the technical requirements for progress monitoring. Typically, teachers administer the tests and then enter the scores they collect. Then, the computer automatically graphs the scores and applies decision rules. This is illustrated in the computer-managed report shown in Figure 49.1. Some software programs are more sophisticated in that they also automatically collect the data and score the student’s test, while the student interacts directly with the computer. If computers are routinely available, then a teacher may wish to consider technological options that reduce the amount of training and experience needed to implement curriculum-based measurement. (See http:// www.studentprogress.org for a consumer report type of analysis of curriculum-based measurement products, some of which offer computer aids.)
Progress Monitoring and Curriculum-Based Measurement as Essential to Responsiveness to Intervention
What is Responsiveness to Intervention?
No instructional method, even those validated using randomized controlled studies, works for all students. For this reason, as schools implement validated interventions within general education, the effects of those interventions on children’s academic performance must be assessed. That way, children who do not respond adequately can be identified promptly for more intensive intervention. For students who fail to respond to a second, more intensive level of programming, a third tier of instruction with greater individualization is implemented, and response continues to be assessed. This iterative process, with which interventions of increasing intensity and individualization are conducted and their effects are continually assessed, describes the education reform known as responsiveness to intervention.
Responsiveness to intervention is conducted within the context of a multi-tier prevention system. The first tier of a multi-tier prevention system is primary prevention where the intensity of instruction reflects general education practice, with or without the use of individual accommodations and adaptations that fit within the general education program and can be managed by the general education teacher. The second tier refers to secondary prevention, which incorporates a greater level of intensity than can ordinarily be accomplished within general education. That is, instruction is delivered in small groups (e.g., three to five students), typically by well-trained (although not necessary certified) tutors, using a prescriptive, research-based or validated intervention. Such a protocol is typically implemented for 10 to 20 weeks. Within some models, multiple doses of small-group, research-based tutoring is used to strengthen effects. If the Tier 2 protocol proves ineffective, then an even more intense level of instruction, the third tier or tertiary intervention, is conducted. This most intense level of instruction is individually formulated and involves individual or dyadic instruction. It often is conducted under the auspices of special education resources, using special education certified teachers who are well versed in how to design individually tailored instruction. Within a responsiveness-to-intervention system, therefore, assessment plays three important roles:
(a) identifying who should be targeted for attention;
(b) quantifying responsiveness to intervention among those targeted for attention; and (c) tailoring individualized instructional programs for the most unresponsive subset of children. Curriculum-based measurement figures prominently for all three purposes.
Identifying Who should Be targeted for Attention
Within this scheme the first assessment function is identifying a subset of the school population that is suspected to be at risk for poor learning outcomes. These students become the focus of the responsiveness-to-intervention system. Typically, a brief measure is administrated to all students in a school or within targeted grade levels within a school. Then, a cut-off is applied that specifies what score on the test is associated with inadequate performance on a valued outcome measure, such as a high-stakes test. All students scoring below this cut-off are designated at risk for poor outcome.
This screening, which relies on a one-time test administration, is known as benchmark assessment. Technically, it is not a form of progress monitoring, which requires more frequent (typically, at least monthly) assessment. We do note, however, that prominent screening tools borrow curriculum-based measurement tools because the reliability and validity of curriculum-based measurement is strong and because the measures tend to be brief. We also note that benchmark assessment for the purpose of screening (i.e., designating risk) carries a significant danger of identifying false positives (i.e., designating students for tutoring within a multi-tier prevention system when, in fact, those students would go on to develop strong academic skills without tutoring). For example, in a recent first-grade responsiveness-to-intervention experiment (Fuchs, Comp-ton, Fuchs, & Bryant, 2006), 50% of the control group, who had been designated at risk according to benchmark screening but who did not actually receive tutoring, spontaneously recovered by the end of the first semester of first grade. False positive errors are expensive for a responsiveness-to-intervention system because they require that costly resources be allocated to students who do not require them.
Because benchmark screening, especially at kindergarten and first grade, typically overidentifies students for Tier 2 tutoring, one-time screening should probably constitute only the first step in designating risk status. That is, we recommend that students who are first suspected to be at risk based on benchmark screening be followed with 5 to 8 weeks of progress monitoring while Tier 1 general education is implemented. The purpose of this short-term progress monitoring is to gauge response to Tier 1 general education and thereby confirm that the suspected risk, based on benchmark screening, more likely constitutes actual risk for reading or math failure. Such short-term progress monitoring greatly increases the precision of designating who requires a Tier 2 intervention and therefore avoids wasting costly Tier 2 services on students whose academic skills would develop nicely without that special intervention.
Quantifying Responsiveness to Intervention
Within a multi-tier prevention system, a second purpose for progress monitoring occurs at Tier 2, where tutoring is based on standard treatment protocols. With a standard treatment protocol, a validated or research-based approach to intervention is implemented in small groups. The assumption is that a vast majority of students should respond well to the validated or research-based tutoring. If a child responds poorly to instruction that benefits most students, then the responsiveness-to-intervention assessment process eliminates instructional quality as a viable explanation for poor academic growth and, instead, provides evidence of a disability. The purpose of progress monitoring at Tier 2 is to determine whether students do or do not respond to validated small-group tutoring; that is, to provide early intervention to students who benefit and to identify the subset of students who do not benefit for a more intensive level of instruction. The students who fare well (and respond) are returned to Tier 1, where progress monitoring is continued to assess whether any additional Tier 2 tutoring is required.
Tailoring Individualized Instructional Programs
When the Tier 2 progress-monitoring data indicate that the student has responded inadequately to Tier 2 tutoring, the student enters tertiary, or Tier 3, intervention. This is typically conducted with special education resources and personnel. At the tertiary or Tier 3 level, instruction differs from Tier 2 because it is (a) more intensive (usually involving longer sessions conducted in smaller groups, if not individually); and (b) individualized (rather than relying on a validated treatment protocol). At Tier 3, progress monitoring is essential for two purposes: (1) to inductively formulate instructional programs that are optimal for the individual student and (2) to determine when the student’s response to Tier 3 instruction is adequate to warrant a return to Tier 1 primary prevention (general education, with or without accommodations or modifications) or to Tier 2 small-group tutoring with continued progress monitoring so that tertiary intervention can be re-initiated as needed.
Conclusion
An essential component of classroom assessment is systematic progress monitoring. Teachers use progress monitoring for two purposes. First, teachers use progress monitoring to determine whether a student’s academic development within an academic year is proceeding well. Second, when a student is not progressing adequately, teachers use progress monitoring to design an individualized instructional program that promotes academic growth. The form of progress monitoring with the strongest scientific evidentiary base is curriculum-based measurement. A large body of research shows that curriculum-based measurement produces accurate descriptions of student development in reading and math. In addition, formal school-based experiments, where teachers are randomly assigned to plan instruction with and without curriculum-based measurement, demonstrate that when teachers use curriculum-based measurement to inform their instructional decision making, their students achieve better. Research on the use of curriculum-based measurement for the purpose of identifying students with learning disabilities represents a new avenue of scientific inquiry. In addition, research designed to expand curriculum-based measurement to other grade levels and content areas is under way.
See also:
Bibliography:
- Baker, S., Gersten, R., Flojo, J., Katz, R., Chard, D., & Clarke, B. (2002). Preventing mathematics difficulties in young children: Focus on effective screening of early number sense delays (Technical Report No. 0305). Eugene, OR: Pacific Institutes for Research.
- Compton, D. L., Fuchs, D., Fuchs, L. S., & Bryant, J. D. (2006). Selecting at-risk readers in first grade for early intervention: A two-year longitudinal study of decision rules and procedures. Journal of Educational Psychology, 98, 394-409.
- Compton, D. L., Fuchs, L. S., & Fuchs, D. (2006). The course of reading and mathematics disability in first grade: Identifying latent class trajectories and early predictors. Manuscript submitted for publication.
- Deno, S. L. (1985). Curriculum-based measurement: The emerging alternative. Exceptional Children, 52, 219-232.
- Deno, S. L., Jiban, C., & Spanjers, D. (2006, February). Monitoring math progress: Grades 1-6. Paper presented at the annual meeting of the Pacific Coast Research Conference, Coronado, CA.
- Espin, C. (2006, February). The technical features of reading measures. Paper presented at the annual meeting of the Pacific Coast Research Conference, Coronado, CA.
- Fuchs, D., Compton, D. L., Fuchs, L. S., & Bryant, J. D. (2006, February). Prevention and identifying reading disability. Paper presented at the annual meeting of the Pacific Coast Research Conference, Coronado, CA.
- Fuchs, L. S., Compton, D. L., Fuchs, D., Paulsen, K., Bryant, J. D., & Hamlett, C. L. (2005). The prevention, identification, and cognitive determinants of math difficulty. Journal of Educational Psychology 97, 493-513.
- Fuchs, L. S., & Deno, S. L. (1991). Paradigmatic distinctions between instructionally relevant measurement models. Exceptional Children, 57, 488-501.
- Fuchs, L. S., & Fuchs, D. (1998). Treatment validity: A unifying concept for reconceptualizing the identification of learning disabilities. Learning Disabilities Research and Practice, 13, 204-219.
- Fuchs, L. S., Fuchs, D., & Compton, D. L. (2004). Monitoring early reading development in first grade: Word identification fluency versus nonsense word fluency. Exceptional Children, 71, 7-21.
- Fuchs, L. S., Fuchs, D., Hosp, M., & Jenkins, J. R. (2001). Oral reading fluency as an indicator of reading competence: A theoretical, empirical, and historical analysis. Scientific Studies of Reading, 5, 239-256.
- Lembke, E., & Foegen, A. (2006, February). Monitoring student progress in early math. Paper presented at the annual meeting of the Pacific Coast Research Conference, Coronado, CA.
- Seethaler, P. M., & Fuchs, L. S. (2006). Reliability, concurrent validity, and predictive validity of a curricular sampling approach to curriculum-based measurement in mathematics at kindergarten. Research in progress.
Free research papers are not written to satisfy your specific instructions. You can use our professional writing services to order a custom research paper on any topic and get your high quality paper at affordable price.
ORDER HIGH QUALITY CUSTOM PAPER

Always on-time

Plagiarism-Free

100% Confidentiality

