
This sample Audition Research Paper is published for educational and informational purposes only. If you need help writing your assignment, please use our research paper writing service and buy a paper on any topic at affordable price. Also check our tips on how to write a research paper, see the lists of psychology research paper topics, and browse research paper examples.
We use sound to communicate, to identify and locate sound-emitting objects, and to provide us with entertainment through the making of and listening to music. The study of these functions makes up large portions of the psychological study of audition under the categories of speech perception, auditory localization, scene analysis, and music perception. Understanding these topics often requires knowledge of psychological areas that may at first seem to have little relation with them but that are of great importance for understanding them. Some knowledge of the physics of the sound stimulus and of the anatomy and physiology of the ear and brain is needed for the fruitful study of auditory perception. Related fields include acoustics in engineering and the biological and medical study of hearing.
Knowledge of the physics of sound and the structure and function of the ear and brain can be important for the design and interpretation of experiments that may seem purely psychological. For example, early estimates of the frequency range of human hearing ranged from lows of 8 Hz to highs of 55,000 Hz, ranges that are considerably different from the currently accepted 20 Hz to 20,000 Hz for young adults (Hertz, Hz, and cycles per second, cps, are synonymous). The errors were mostly caused by a lack of consideration for the overtones (frequencies higher than the fundamental frequency, called harmonics when they are multiples of the fundamental frequency) produced by the whistles and tuning forks used in the studies (Boring, 1942).
Although psychologists have been and continue to be involved in anatomical and physiological investigations of the ear and the brain, the psychological study of hearing is primarily based on human behavioral responses to sound stimuli. The measures include simple yes-no responses, the estimation of magnitude, ratings, interpretations of speech sounds, and many others. A good knowledge of psychophysical techniques and their limitations is important (see Krantz’s Chapter 20 on Psychophysics).
Experimental work in audition is motivated by both applied and theoretical concerns. Applied work might include topics in human factors such as how changes in hearing might affect the elderly when they drive, or how blind people might use ambient sound to orient themselves in an environment. Auditory research can also be applied to clinical areas, such as how hearing loss might increase paranoid thoughts (Zimbardo, Anderson, & Kabat, 1981). More theoretical investigators may concern themselves with the physiology of the ear and brain or with more traditional psychological topics. For example, Cusack and Carlyon (2003) looked into similarities between the feature integration theory of visual object perception and the discrimination of auditory features such as sound duration.
History
Researchers have studied sound, hearing, and music for thousands of years. Pythagoras (approximately 582-510 BCE) used plucked strings to note the relation between the length of the string, the pitch of the note, and the musical quality of the note. He (and, no doubt, many others) noted that when the string’s length is decreased to one half of its original length, the higher pitch produced was that of the same note one octave above the original note (Boring, 1942). As we now know, the string’s rate of vibration is proportional to its length, and an increase of one octave is a doubling of the original frequency.
Aristotle (approximately 384-322 BCE) wrote that sound was produced when air was moved in a sudden, powerful way so that it moved as a single packet and did not dissipate. He also noted that sound could be heard in, and therefore carried by, both air and water. He was correct in that air has to be moved quickly in order to produce audible sound, but he did not describe the continuous vibrations present in most sounds.
The scientific study of sound and hearing began when craftsmen and physicists produced instruments to measure and produce sounds. Their early experiments used tuning forks and sirens to produce pitches, and they obtained variations in loudness by such devices as varying the weights of steel balls dropped on ebony plates (Boring, 1942). Precise and relatively inexpensive control of intensity and frequency became possible when electronic amplifiers and oscillators were invented in the early 1900s. Also, as an indication of the greater precision made possible by electronics, pitches began to be given in terms of frequency rather than in terms of musical notes.
Physicists such as Helmholtz, Mach, and Ohm did early work on sound and hearing. Ohm’s acoustic law stated that we are able to perceive the separate sine wave components of a complex tone that would be revealed when doing Fourier analysis of the tone. Ohm’s law complemented Helmholtz’s theory that the basilar membrane of the inner ear was made up of a series of resonators, each most sensitive to a different sound frequency. The physicist Max Wien made an early measurement of the lower limit of sound intensity that is audible. Smith calculated that the amount of energy that a blade of grass used as it grew and raised itself from the ground, if translated into a sound frequency of about 4,000 Hz, would be perceived as the same loudness as a quiet bird call or the sound of a refrigerator running—that is, about 40 dB (Jones, 1937).
Early psychologists such as Stumpf, Munsterberg, and later Stevens did much work in clarifying how—and how well—people could locate sound-emitting objects (Boring, 1942). Looking through the early volumes of the Journal of Experimental Psychology, one can find articles on whether pitch and volume have separate psychological realities (Rich, 1916) and on the possibility of producing illusions of movement using sound stimuli (Burtt, 1917). Both of these articles, done prior to the widespread availability of electronic sound-generating equipment, devoted considerable space to describing their custom-built experimental apparatus.
Physical Stimulus
Sound is created by a rapid change in pressure in the atmosphere (or some other material) over time, caused by a vibrating solid (or some other source) that alternately compresses and rarifies (decompresses) the air next to it. These changes are rapidly communicated to the neighboring air molecules, creating compression waves, or frequencies. We can perceive, depending on our age and the intensity of the sound, frequencies between about 20 and 20,000 Hz (cps). These frequencies produce extremely small movements of our eardrum that lead to movements of the hair cells (cilia) in the inner ear, which are then translated into nervous impulses to be processed in the brain. The intensity—the amount of pressure change—is generally given in terms of decibels, dB = 20 log10 (p1/p0). This is a compressed scale that allows a very large range of pressure differences to be described within a reasonable range. Pressure ratios from 1 to 10,000,000 are given by a range from 0 to 140 dB. The p0 in the equation is generally set to 20 microPascals, a value based on the human absolute threshold for hearing a 1,000 Hz tone. When calculated in this fashion, the dB level is called a sound pressure level (SPL). Occasionally p0 is set to the participant’s personal threshold, and the value is known as the sensation level. Generally, the greater the pressure change, the louder the sound.
The number of alternations between high and low pressure per unit time—the frequency—is given in Hertz (Hz), or cycles per second. Generally, the higher the frequency, the higher the perceived pitch. The pitch of a complex tone, anything other than a simple sine wave-shaped tone, depends on factors other than the average frequency. For example, if sine wave tones of 600, 800, 1,000, and 1,200 Hz were combined, the perceived pitch would be similar to one produced by a 200 Hz tone.
The most natural depiction of sound is in a figure that shows the intensity on the y-axis and time on the x-axis. This can be called a description of the sound on the time domain. Because waveforms can be synthesized by combinations of simple sine waves of varying frequencies, intensities, and phases, sound can also be described on the frequency domain with intensity again on the y-axis and frequency on the x-axis. (Figures 25.1 and 25.2 show a combination of a 300 and a 500 Hz tone in the time and frequency domains.) It is also possible to combine these two domains with a spectrogram. In this display, time is on the x-axis, frequency is on the y-axis, and intensity is encoded by color (Figure 25.3).
Sound waves, like almost any other sort of wave, can be broken down into a set of sine waves (a wave that changes in magnitude in ways that can be mapped onto the trigonometric sine function) using a method discovered by Fourier (1768-1830). It appears that the ear does something similar to a Fourier analysis of sound waves, breaking them down into a set of simple sine waves.
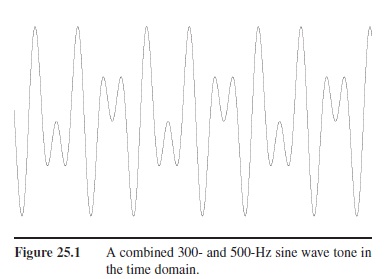 Figure 25.1 A combined 300- and 500-Hz sine wave tone in the time domain.
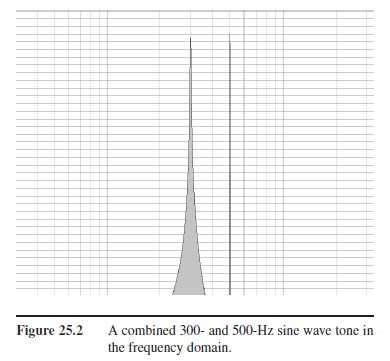 Figure 25.2 A combined 300- and 500-Hz sine wave tone in the frequency domain.
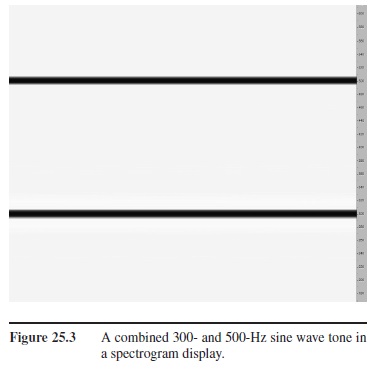 Figure 25.3 A combined 300- and 500-Hz sine wave tone in a spectrogram display.
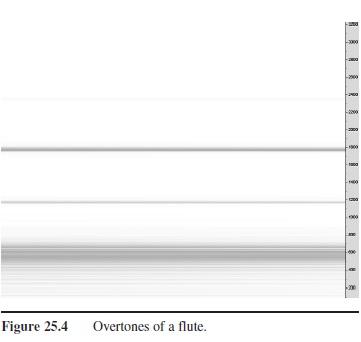 Figure 25.4 Overtones of a flute.
When our voices or musical instruments produce a tone—a particular frequency—they also produce tones at integer multiples of that frequency. These overtones, or harmonics (or partials), are part of what goes into the particular sound or timbre of the voice or instrument. (Figure 25.4 shows a spectrogram of the fundamental frequency and harmonics produced by a flute.)
It is often important to use higher-order descriptions such as how the intensity of a sound varies with time (amplitude modulation) or how its frequencies change with time (frequency modulation). For example, the difference between a piano note and an organ note (the difference in timbre) is due, in large part, to the way the intensity of the note changes with time, its intensity envelope (Figure 25.5). And, the identification of words requires noting the changes in frequencies of vowel formants, frequencies in the speech signal having relatively high intensities (Figure 25.6).
The sounds we hear are made up of noise and tones. Although we can define noise as any unwanted sound, in this discussion it refers to sound that is made up of a more or less random collection of frequencies that each exist for short periods of time. A tone is a continuous (although possibly changing) frequency. Our voices are made up of a combination of the two. Very roughly, vowels are made up of changing tones and consonants are made up of noises (often accompanied by tones). There are several named types of noises. White noise, which sounds something like two dry hands being rubbed together, is made up of frequencies that are all of the same average energy. Due to the way our hearing system works, it sounds rather high-pitched. Pink noise has equal energy per octave—that is, the interval of frequencies from 200 to 400 Hz has the same amount of energy as the interval between 400 and 800 Hz or between 800 and 1,600 Hz. Both pink and white noise can be used to mask background noise or the perceived ringing noise produced by tinnitus. Pink noise is particularly useful in setting up audio equipment through the use of analyzers and equalizers that are calibrated in octaves or fractions of octaves. Another category of noise, band-pass noise, noise from which upper and lower frequencies have been eliminated, is often used in auditory experiments.
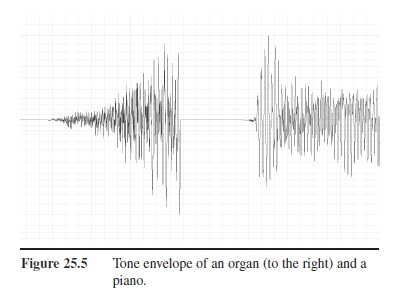 Figure 25.5 Tone envelope of an organ (to the right) and a piano.
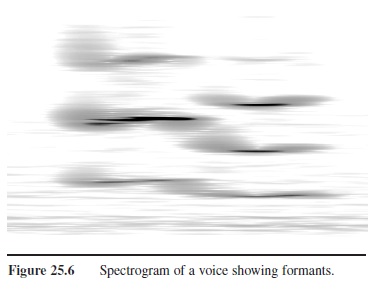 Figure 25.6 Spectrogram of a voice showing formants.
The Ear And The Brain
The structures that make up the ear transform the sounds presented to us by the outside world into neural signals. This output mirrors the time relations in the original sound and encodes the frequencies in the sound through a combination of duplicating the frequency of the sound (temporal coding) and carrying the information concerning different frequencies with different neurons (place coding).
When the sound acts to vibrate the eardrum (tympanic membrane), it has already been modified by the shape of the side of the head, the external ear (pinna, auditory meatus), and the ear canal. The contours of the outside structures both filter and amplify certain frequencies, the pattern of the modification depending a bit on the direction the sound is coming from. This directionally dependent filtering can help us locate auditory objects. The shape of the entrance to the ear canal and the ear canal produces a horn that amplifies frequencies between about 1,000 and 4,000 Hz.
Water is harder to move than air. Sound that travels freely through the air will be simply reflected by water. This can be seen from the fact that noises coming from the outside world are only faintly heard by someone under water. In order to affect the sensory cells in the fluid-filled inner ear, the motions of the air molecules must be concentrated, decreased in extent but increased in pressure. The structures of the middle ear—the eardrum and ossicles (three small bones, the malleus, incus, and stapes)—serve this purpose, matching the impedance (ease of movement) of the air with that of the fluid in the cochlea. The eardrum has an area of about 55 mm2. After passing through the ossicles, the smallest bones in the body, the size of the end plate of the last ossicle, the stapes, is about 3.2 mm2. This difference in size increases the pressure by a factor of 17 (Luce, 1993). This increase, along with leverage produced by the ossicles, results in an increase of pressure by about 30 times.
The ossicles are attached to two muscles that can decrease their mobility. Intense sounds cause these muscles to contract and lessen the amount of sound that reaches the inner ear, especially those of lower frequency. The acoustic reflex probably has several functions. It allows very loud sounds, sounds that would normally be too powerful to be processed by the hair cells, to be perceived more accurately. Another plausible function is to prevent the low-frequency speech sounds that are transmitted to the middle ear through the bones of the skull from interfering with our perception of outside events (Buser & Imbert, 1992).
The inner ear contains a complex active mechanism that separates in a very precise way the different frequencies that make up a sound into different positions along the length of the inner ear. The cochlea (most typically pronounced with an ah sound rather than an oh sound), where sound is transduced into nervous impulses, is a hollow area shaped somewhat like a snail’s shell. If it could be straightened its length would be about 3.5 cm. It is divided lengthwise by two membranes. Reisner’s membrane separates the upper chamber, the scala vestibuli (vestibular canal) from the scala media (cochlear canal). The bottom of the scala media is made up of the basilar membrane upon which the sensory cells for audition, the hair cells, rest. The area below the basilar membrane is the scala tympani (tympanic canal). At the apex of the cochlea (the tip, if it were straightened) is a small hole, the helicotrema, that joins the scala vestibuli and scala typani. The stapes is connected to the scala vestibuli by means of the oval window, which is a membrane-covered oval hole in the vestibule of the inner ear. In order to allow the stapes to move the fluids in the cochlea, a second flexible membrane-covered hole, the round window, is located at the base of the scala tympani.
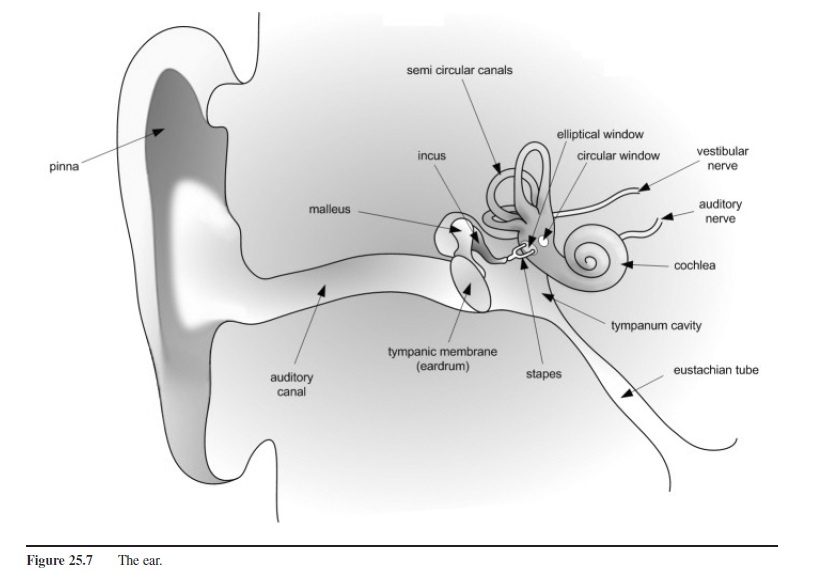 Figure 25.7 The ear.
The receptor cells—the inner and outer hair cells—are located above the basilar membrane. The vast majority of the signals sent from the ear to the brain are from the inner hair cells. The tectorial membrane is located above the hair cells. When waves travel through the cochlea, differences in motion between the tectorial membrane and the basilar membrane cause hairlike stereocilia attached to the top of the hair cells to move. When this happens, filaments that exist between the stereocilia pull open ion channels in the hair cell, allowing potassium ions to enter. This eventually causes the release of a neurotransmitter, most probably glutamate, into the synaptic cleft between the hair cell and an auditory nerve cell. In short, pressure on the hair cells results in the generation and transmission of neural impulses that ultimately travel to the brain.
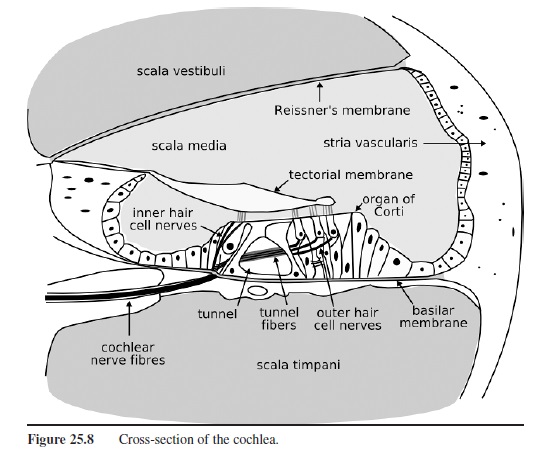 Figure 25.8 Cross-section of the cochlea.
When a sound wave is transmitted to the cochlea, the mechanical properties of the basilar membrane produce a wave in that membrane that travels down the length of the cochlea, but it has a maximum height in a place that depends on the sound’s frequency. High frequencies pro-duce a maximum height near the base (where the oval and round windows are located); low frequencies produce a maximum height at the apex (near the helicotrema). The cochlea’s ability to separate similar frequencies is better than would be expected from a passive mechanism. Apparently the outer hair cells, which contain proteins similar to those in muscle cells, somehow act to fine-tune this process by acting as both an amplifier and a filter.
The processing of sound by the brain is not as well understood as that of vision. There are multiple areas in the brain where processing occurs and many interactions between lower and higher centers, as well as between centers on either side of the brain. Like the visual cortex, the auditory cortex contains numerous mappings and numerous specialized cells. Maps in the visual cortex are retinotopic (adjacent areas of the retina are mapped in adjacent areas of the cortex), whereas maps in the auditory cortex (and in other auditory brain areas) are tonotopic (adjacent frequencies are mapped in adjacent areas of the cortex). Cortical cells have been found that respond best to sounds coming from similar positions in space, sound increasing or decreasing in frequency, sounds changing in amplitude, complex sounds such as noise or clicks, or several other qualities (Moore, 2004). Damage to the human auditory cortex does not eliminate the perception of sound, but it can result in loss of higher-order perceptions such as the ability to locate sound sources (Zatorre & Penhune, 2001), or to perceive qualities associated with music (Samson, 1999), or to perceive speech (Boatman, 2006).
Loudness, Pitch, And Localization
In the next section we will consider two basic subjective qualities of sound, loudness and pitch. These qualities are strongly related to the physical quantities of intensity and frequency. Relations exist within these pairs as well as between them. Intensity cannot exist independently of frequency—any sound has both—and the shortest transient change in pressure can be analyzed into multiple frequencies. Within the psychological qualities, loudness depends upon pitch—a very low-pitched tone sounds much less loud than a higher-pitched tone when both have the same energy. Also, changing the loudness of a tone can change its perceived pitch.
Loudness
Loudness is the perceptual quality that is most strongly correlated to the intensity of the sound. Loudness, however, is also related to the frequency of the sound and, to a much lesser extent, the duration, bandwidth, and context of the sound.

Psychological Measures of Loudness
Loudness can only be measured indirectly through the responses of participants in psychophysical studies. There are two widely used units of loudness, the phon and the sone. The phon is based on the loudness of a 1,000 Hz tone at various sound pressure levels, the sound pressure level equaling the phon value. For example, a 40 dB 1,000 Hz tone has the loudness value of 40 phons. A tone of any frequency that is judged to have the same loudness also has a value of 40 phons. Curves showing equal loudness across frequencies, equal loudness contours, show the way that loudness varies across tone frequencies. Figure 25.9 shows the relation between loudness and frequency at 40 and 80 dB. Note that as the tone frequency increases or decreases from 4,000 Hz, the perceived loudness decreases. Note also that at higher sound pressure levels the curve is flatter. If you wished a 30 Hz bass tone to be as loud as a higher frequency tone, you would not have to increase it as much at higher dB levels.
Although the phon is an adequate measure of loudness for many purposes, it is not a ratio scale—80 phons is not twice as loud as 40 phons. In order to have a more psychologically relevant unit, Stanley Smith Stevens (1936) proposed that a new unit be used, the sone. One sone is defined as 40 phons, the loudness of a 1,000 Hz tone at 40 dB (a 40 dB sound is approximately as loud as the normal background noise present in a quiet office). When another Equal-loudness contours (solid) from ISO 226:2003 revision) Original ISO standard shown (dashed) for 40-phons tone’s intensity is adjusted so that it is perceived to be twice as loud, that sound is given the value of two sones. If a tone is modified to be half as loud, that tone is given the value of one half sone. This method of scaling loudnesses is called ratio production and was often used by Stevens.
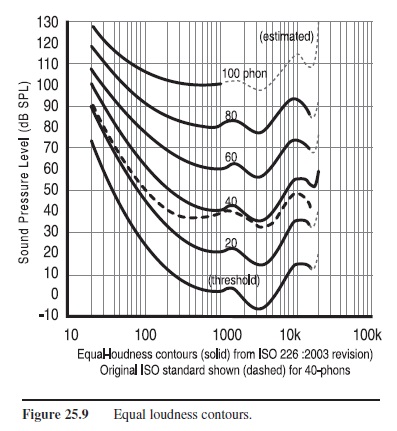 Figure 25.9 Equal loudness contours.
Time and Loudness
The auditory system requires time to process loudness. It seems as if the loudness of a sound takes time to get up to its true level. Up to about 200 ms, increasing the length of a sound of a certain intensity produces increased loudness. Below 80 ms, it seems that there is a direct tradeoff between duration and intensity—any combination of the two that leads to the same overall amount of energy is heard as equally loud. The relation beyond 80 ms is more complicated (Moore, 2004)
Duration can also decrease loudness. In the same way that we adapt to the pressure sensations of the clothes we wear, the sensation of loudness undergoes adaptation. There is conclusive evidence that the rate of firing measured in the auditory nerve decreases with time. The psychophysical evidence has been mixed as to the exact details of loudness adaptation, and this decrease in loud-ness is difficult to notice in everyday life. However, the results of several studies show that a fairly large amount of loudness adaptation occurs (Jones, Weiler, Warm, Dember, & Sandman, 2003; Hellman, Miskiewicz, & Scharf, 1997). A possible real-life example of loudness adaptation is the extreme difference in apparent loudness of a car radio when the volume setting of the night before seems too loud when starting the car the next morning.
Other Loudness Phenomena
Contrast effects, like those in vision, can also occur. The judgment of the loudness of a quiet tone is decreased if that tone is preceded by a louder tone (Garner, 1954). Whether this is more a matter of judgment than sensation is uncertain (Melamed & Thurlow, 1971). An opposite effect can occur when tones of different frequencies and intensities are heard simultaneously. Marks (1994) found that in this situation, given sufficient differences in frequencies, the less intense sound increases in loudness. This is a process of assimilation rather than contrast. Marks suggested that this phenomenon might be due to greater adaptation to the louder tone than the softer tone.
The frequency makeup of noise also influences loud-ness. If the upper and lower limits of bandpass noise (noise limited to frequencies within certain limits) are extended while the overall energy of the noise remains constant, loudness increases. But this will only occur when the bandwidth is larger than a certain size. Apparently, if the bandwidth is too small, only receptors specific to a certain frequency are affected. When the bandwidth is larger, receptors that encode several frequencies are stimulated and their combined activity produces a greater sensation of loudness. The bandwidth within which the loudness does not change is called the critical bandwidth and is an important quantity in many areas of hearing research.
When two separate tones are present, the loudness of their combination depends on how closely their frequencies lie. If the two equally intense tones are very close, the loudness of the tones will alternately increase and decrease as the pressures changes in the tones either add to or subtract from each other. This phenomenon is known as beating and can be heard when two guitar strings are tuned to nearly the same note. When the tones are farther apart and the beats disappear, the combined tones gradually increase in loudness until the two tones seem about twice as loud as one of them alone (Zwicker & Fastl, 1990).
Neural Coding of Loudness
Perhaps the most natural way for neurons to carry information about the intensity of a sound is through their firing rate. This explanation seems unlikely, though, when the limited frequency range of neuron action potential rates is compared with the 1 to 10,000,000 range of pressure differences that we can sense.
One possible way of encoding loudness is through an increase in the area of the cochlea stimulated, with a corresponding increase in the number of different neurons responding, as the intensity of the tone increases. However, when the area available for stimulation is limited by the presence of masking noise above and below the frequency of the tone that is being judged, loudness perception is still accurate (Plack, 2005).
The mechanical action of the cochlea along with the amplification of only low-intensity sounds by the action of the outer hair cells act to compress the frequency range needed to be carried by the auditory nerve (in the same way the decibel scale compresses the huge differences in pressure). There is also evidence that the cochlear nucleus, the first brain area to process information coming from the cochlea, acts to compress the neural loudness signal (Zeng & Shannon, 1994).
Pitch
Pitch is the perceptual quality that is most strongly correlated with the frequency of the sound. Psychologists and others studying audition have defined several types of pitch. There is tonal pitch, the type of pitch that we normally think of as pitch, related to the sinusoidal components of the sound. Periodicity pitch requires only that a sound (or sound gap) occur in a regular manner. Tone height is the simple judgment that one sound is higher or lower in pitch than another. Tone chroma, or musical pitch, includes judgments of octaves and other musical intervals. Melodies require tone chroma. Until the maturation of the psychological study of music, psychologists generally investigated tone height. Currently, some psychologists such as Plack (2005) believe that the term pitch should be limited to those sensations that can be used to produce musical melodies.
The fact that pitch does not require a continuous tone has been known for many years. One of the earliest apparatuses for producing high-frequency sound was Savart’s wheel, used in the first part of the 19th century. A thin card was held against the rotating teeth of a rapidly spinning gear. Although the sound produced was very different from that of a sine-wave tone or of a tone produced by a musical instrument, a definite pitch, usable to produce melodies at low enough frequencies, could be heard that matched the frequency of the gear teeth striking the card (Boring, 1942). If, in your youth, you ever placed a card or balloon so it hit the spokes of a bicycle wheel, you have experienced something similar to Savart’s wheel. In a more recent example, Miller and Taylor (1948) used regular interruptions of white noise to produce stimuli that had the quality of pitch. Plack believes that all pitch is periodicity pitch. The sensation of pitch that is produced by a sinusoidal tone is merely a special example of periodicity pitch, where the period is that of some portion of the waveform.
Pitch Sensitivity
People are very sensitive to changes in pitch. Below 1,000 Hz, people can reliably distinguish pure tones less than 1 Hz apart (some sources double the needed difference). As frequency increases, the just noticeable difference increases, but even at 10,000 Hz differences of 100 Hz can be distinguished. The Weber’s fraction for pitch discrimination is approximately 1/333. This is considerably better than that for loudness discrimination (1/11) or visual brightness discrimination (1/62). The ability to hear higher frequencies decreases markedly with age, a condition called presbycusis.
Intensity and Pitch
As mentioned previously, the intensity of a sound can alter its pitch, but the amount of change seems to vary a great deal among observers. Stevens found rather large differences in a participant whom he labeled as a good responder. Increasing the intensity led to an increase in pitch of about 10% for high frequencies, a decrease in pitch of about the same extent for low frequencies, and no change for tones at 3,000 Hz. Later studies found much fewer differences, and those were only for certain participants (Gelfand, 1998).
Measuring Pitch
Because of the strong relation between pitch and frequency, it is not uncommon for studies to use frequency (Hz, cycles per second) to refer to pitch. Doing so may be useful in many cases, but our perception of pitch can vary considerably from the stimulus frequency. One of the first attempts to develop a psychological scale for pitch was done by Stevens and others in 1937 using methods similar to those they used in developing the sone scale of loud-ness, described in a previous section. A sinusoidal tone of 1,000 Hz at 40 dB was assigned the value of 1,000 mels. Participants then used the method of fractionalization—for example, changing the frequency until the tone appeared to have twice the original pitch, giving that pitch the value of 2,000 mels. The resulting mel scale showed a subjective compression of the frequency values. For example, the 2,000 and 4,000 Hz stimuli were given the mel values of approximately 2,000 and 3,000 mels (Siegel, 1965). Stevens’s data deviated considerably from a power curve when the stimuli were much higher or much lower than 1,000 Hz. A replication by Siegel suggested that the reason for this could have been the age of the participants (the older the participant, the less well he or she can hear high-frequency tones) and the sound insulation in the listening room, which absorbed high frequencies more than low frequencies. This finding, as well as one by Greenwood (1997) that Stevens’s data was potentially biased by the participants’ listening to ascending series of stimuli more than descending series, makes it clear that extreme care must be taken when doing psychophysical experiments.
A more recent pitch scale is the bark scale, based on critical bands. As you may recall from the section on loud-ness, extending the range of noise (without changing its energy) within a critical bandwidth doesn’t alter apparent loudness, but expanding it beyond this bandwidth increases the loudness. Also, two tones that are separated by less than the critical bandwidth result in the perception of beats, an increase and decrease of their loudness. Once the tones are separated by more than the critical band, the two tones can be heard separately without any perception of roughness. Critical bands exist around all frequencies, therefore they exist as overlapping bands. However, if frequencies are chosen so that their bands do not overlap, humans have approximately 24 critical bands. These bands increase in width as frequency increases and are proportional to our ability to discriminate pitch. The scale of critical bands ranging from 1 to 24 is the bark scale. Its shape is reasonably close to that of the mel scale (Buser & Imbert, 1992). The erb scale (standing for the equivalent rectangular bandwidth) is similar to the bark scale, but it measures the intervals in a way that is less subject to error.
Musical Pitch
Musical pitch, or tone chroma, is qualitatively different than tone height, the sort of pitch that is measured by the mel and bark scales. Musical tones are measured in scales of repeating notes, where musically similar tones are an octave apart. Middle C on the piano sounds qualitatively similar to all the other Cs on the keyboard. Musical intervals such as octaves and fifths are directly related to frequencies. Raising a note by an octave doubles the frequency. Raising a note by a fifth, going from an A to an E, increases the frequency by 3/2. Raising it by a fourth increases the frequency by 4/3. The actual tuning of musical instruments does not match these perfect ratios in order that transpositions from one key to another on an instrument with fixed notes, such as an organ or a piano, will retain these intervals as closely as possible. Preference for intervals such as an octave or a fifth seems to occur in cultures having very different musical traditions and are therefore probably innate.
Musical instruments produce complex tones, not simple sine-wave tones. Even a simple plucked string produces not just a single frequency, the fundamental, but also multiples of that frequency, called harmonics. The quality of a note that can distinguish one instrument from another is called its timbre (often pronounced “tamber”). The relative strength of the harmonics is a major component of timbre. When two notes are played together, the overtones of those notes can produce either consonance or dissonance. Dissonance occurs when the overtones of the notes are closer than a critical bandwidth apart and, as we mentioned before, they combine to produce an audible roughness.
Because our auditory system is sensitive to the periodicity of sound, the fundamental can be heard even if only the overtones are present. For example, when the lowest key on a piano is struck, the fundamental is clearly heard even though it is extremely weak in comparison to the overtones. As another example, when music is played through a very small speaker, bass notes are heard even if the speaker is physically incapable of producing them. The reason why this occurs can be seen when the combination of several overtones is graphed in the time domain.
It is not necessary that a tone be heard in order that pitch may be heard. If a 500 Hz sine wave is produced that is only 5 thousandths of a second long, it is heard as a click rather than a tone. However, if it is compared to a 1,000 Hz tone of the same length, the difference in pitch is clearly perceptible. The sound must be at least a few complete wavelengths long for this pitch to be heard.
Neural Coding of Pitch
Pitch seems to be encoded in the auditory nerve by at least two related mechanisms. The first code, the rate-place code, is based on the fact that the maximum displacement of the traveling wave in the cochlea depends on the frequency of the tone. If only a single frequency is present, the maximum activity of the hair cells occurs at the point of the cochlea where this wave is at a maximum. The greater the intensity of the tone, the more rapidly the neurons associated with those hair cells fire. Frequency is encoded by the particular set of neurons that are firing most rapidly. There is disagreement over whether this mechanism is sufficient to explain frequency sensitivity and qualitatively different types of pitch. Many auditory scientists believe that an additional mechanism is needed. Axons in the auditory nerve lock into a particular phase of the sound wave, a single portion of the waveform. Thus, the firing rate of the neuron can encode not only the intensity of a sound, but also its frequency. Limitation in firing rates of neurons prevent a direct encoding of moderately high frequencies, but the combined output of several neurons, even if some waves are missed, contains sufficient information to encode frequencies up to about 5,000 Hz in a very accurate manner. This timing code may be related to musical pitch in that frequencies over 5,000 Hz cannot be classified as particular musical notes.
The missing fundamental that can be heard when overtones are present is not generally produced in the cochlea, although it can be if the harmonics are sufficiently intense (Plack, 2005). Houtsma and Goldstein (1971) found that melodies with notes including only two randomly chosen harmonics were easily recognizable when the harmonics were presented to the same ear. They are also heard when the two harmonics are presented dichotically, one harmonic to each ear. This suggests that the pitch of the missing fundamental is computed in the brain rather than in the cochlea. Further evidence of the central processing of the missing fundamental can be seen when the harmonics are presented successively rather than simultaneously and the missing fundamental is still perceived.
Localization
The sense of hearing allows us to find, track, and identify objects that emit sounds. The ability to point to the object is primarily due to the fact that we have two ears and can compare the intensity and timing of the sounds they detect. Secondary cues include the pattern of intensities of different frequencies that occur depending on the sound’s direction because of the shape of our external ear, head, and shoulders. Locating a set of sounds in a particular position in space helps us judge them to be coming from a single source. Finally, the pattern of sound that we receive allows us to judge the sort of space that we are in.
In order to describe how we are able to use our ears to locate objects in space, it is necessary to have a standard description of the space around us. The angle of an object to our left or right is known as the azimuth (from assumut, “the ways” in Arabic). This angle is measured in a clockwise direction, with a 0-degree azimuth directly in front of us, a 90-degree azimuth directly to our right, a 180-degree azimuth directly behind us, and a 270-degree azimuth directly to our left. The up-and-down direction is measured in degrees of elevation. A 0-degree elevation is at the horizon, a 90-degree elevation is straight up, and a -90-degree elevation is straight down. Using these two angles, given a particular starting location and orientation, we can describe any direction. If we add a measure of distance, we can describe any location.
Our ability to use audition to locate the direction of objects varies with azimuth and elevation, as well as with the type of sound. The minimal audible angle, the smallest difference in direction that we can reliably detect, is at 0 degrees azimuth and elevation and at frequencies below 1,000 Hz. The ability to locate sounds is also fairly good above 4,000 Hz, but it is inferior between those two frequencies.
The obvious cause of our ability to locate sounds is the fact that we have two ears separated by about 5.5 inches of space and pointing in opposite directions. If a sound comes from the right, our right ear hears it first and most intensely. If the sound approaches from directly in front, there is no difference in intensity or timing. However, if these were the only two factors used, we would be unable to distinguish sounds directly ahead from those directly behind. Our ability to do so is much better than chance, so other sources of information must exist.
The sense of hearing is our most sensitive gauge of time. We are able to judge that a sound source has changed position using timing cues when the time difference between the ears is about 15 microseconds (millionths of a second). When a continuous sound, such as a sine-wave tone, is heard, something other than the time that the sound first affects the ear must be used if location is to be judged. Recall from the section on pitch that the neurons directly affected by the hair cells tend to fire at one particular point in the sound wave. Because of this, differences due to the phase of the sound wave can be detected by each ear and compared. If the right ear detects the wave’s rising pressure and the left ear detects the peak pressure, the brain has information suggesting that the sound came from the right. Interaural time differences are most effective at lower frequencies. If the frequency is too high, the wavelength is short enough that the phase information becomes ambiguous. By the time the sound travels from one ear to the other, several cycles of the wave may have occurred.
Interaural intensity differences only occur at higher frequencies. If the frequency is too low and the wavelength too long, the head does not effectively block the sound. However, high-frequency sounds are blocked quite well. A 6,000 Hz tone coming from one side of the head decreases by about 20 dB (Moore, 2004). The previously mentioned decrease in accuracy between 1,000 and 4,000 Hz is probably due to switching between time and intensity information. Most sounds encountered in everyday life contain a combination of lower and higher frequencies and both mechanisms are active.
Discriminating elevation and front-to-back location is accomplished by the filtering caused by the shape of the outer ear and head. When the shape of the outer ear is modified by filling in its hollows, the ability to distinguish these directions is greatly reduced. Binaural recordings, recorded with microphones placed in the ears of a replica of a person’s head, provide markedly improved realism. The location of the instruments in an orchestra can be more accurately perceived when one listens through headphones. Unfortunately, the realism disappears if the listener’s head is turned.
The perception of distance is much inferior to that of direction. Loudness can provide distance information if the sound is a familiar one, such as a person’s voice. For a complex sound, the higher frequencies tend to diminish with distance somewhat more than low frequencies because of absorption of high frequencies by the atmosphere.
The judgment that a complex sound comes from a single source is essential for the organization of the auditory world. Sounds that appear to come from the same spatial position are often perceived to be coming from the same source. When position cues are diminished through the use of hearing aids, it becomes more difficult to separate someone’s voice from other noises in the environment or from other voices. Identifying a single instrument when listening to an orchestra can be done even if no positional information is available. The pattern of harmonics and the way in which the intensity of the sound changes over time, factors that produce the timbre of the instrument, are sufficient for its identification.
In any enclosed space (except for an anechoic chamber), a good part of the sound that reaches us from a source comes not directly from that source but from reflections from the walls. This indirect sound reaches us from varying directions and with varying delays, yet only one sound is heard coming from the direction of the object producing it. The fact that we do not separately hear the echoes is due to what is called the precedence effect. The first sound that reaches us suppresses later echoes. Depending on the type of sound, a gap of up to 50 microseconds between the initial sound and the reflected sound produces the percept of a single sound (Gelfand, 1998). Even though only one sound is heard, the echoes provide information concerning the size of the room; the greater the time difference, the larger the room is perceived.
References:
- (350 BCE). On the Soul. Retrieved April, 7, 2007, from classics.mit.edu/Aristotle/soul.html
- Boatman, D. F. (2006). Cortical auditory systems: Speech and other complex sounds. Epilepsy and Behavior, 8, 494-503.
- Boring, E. G. (1942). Sensation and perception in the history of experimental psychology. New York: Appleton-Century.
- Burtt, H. E. (1917). Auditory illusions of movement—a preliminary study. Journal of Experimental Psychology, 2, 63-75.
- Buser, P., & Imbert, M. (1992). Audition. Cambridge, MA: Bradford.
- Cusack, R, & Carlyon, R. P. (2003). Perceptual asymmetries. Journal of Experimental Psychology: Human Perception and Performance, 29, 713-725.
- Garner, W. R. (1954). Context effects and the validity of loudness scales. Journal of Experimental Psychology, 48, 218-224.
- Gelfand, S. (1998). Hearing: An introduction to psychological and physiological acoustics (3rd ed.). New York: Marcel Dekker.
- Greenwood, D. D. (1997). The mel scale’s disqualifying bias and a consistency of pitch-difference equisections in 1956 with equal cochlear distance and equal frequency ratios. Hearing Research, 103, 199-224.
- Hellman, R., Miskiewicz, A., & Scharf, B. (1997). Loudness adaptation and excitation patterns: Effects of frequency and level. Journal of the Acoustical Society of America, 101, 2176-2185.
- Houtsma, A. J. M., & Goldstein, J. L. (1972). The central origin of the pitch of complex tones: Evidence from musical interval recognition. The Journal of the Acoustical Society of America, 51, 520-529.
- Jones, A. T. (1937). Sound, a textbook. New York: Van Nostrand.
- Jones, K. S., Weiler, E. M., Warm, J. S., Dember, W. N., & Sandman, D. E. (2003). Loudness adaptation: Fact or artifact? The Journal of General Psychology, 130, 341-358.
- Luce, R. D. (1993). Sound and hearing. Hillsdale, NJ: Erlbaum. Marks, L. E. (1994). “Recalibrating” the auditory system: The perception of loudness. Journal of Experimental Psychology: Human Perception and Performance, 20, 382-396.
- Melamed, L. E., & Thurlow, W. (1971). Analysis of contrast effects in loudness judgments. Journal of Experimental Psychology, 2, 268-274.
- Miller, G. A., & Taylor, W. (1948). The perception of repeated bursts of noise. Journal of the Acoustical Society of America, 20, 171-182.
- Moore, B. (2004). Psychology of hearing. London: Elsevier. Plack, C. J. (2005). The sense of hearing. Mahwah, NJ: Erlbaum.
- Rich, G. J. (1916). A preliminary study of tonal volume. Journal of Experimental Psychology, 1, 13-22.
- Samson, S. (1999). Musical function and temporal lobe structures: A review of brain lesion studies. Journal of New Music Research, 28, 217-228.
- Siegel, R. J. (1965). A replication of the mel scale of pitch. The American Journal of Psychology, 78, 615-620.
- Stevens, S. S. (1936). A scale for the measurement of a psychological magnetite: Loudness. Psychological Review, 43, 405-416.
- Stevens, S. S. (1937). A scale for the measurement of the psychological magnitude of pitch. Journal of the Acoustical Society of America, 8, 185-190.
- Zatorre, R. J., & Penhune, V. B. (2001). Spatial localization after excision of human auditory cortex. The Journal of Neuroscience. 21, 6321-6328.
- Zeng, F. G., & Shannon, R. V. (1994). Loudness-coding mechanisms inferred from electric stimulation of the human auditory system. Science, 264, 564-566.
- Zimbardo, P. G., Andersen, S. M., & Kabat, L. G. (1981). Induced hearing deficit generates experimental paranoia. Science, 212, 1529-1531.
- Zwicker, E., & Fastl, H. (1990). Psychoacoustics: Facts and Models. Berlin: Springer.
See also:
Free research papers are not written to satisfy your specific instructions. You can use our professional writing services to order a custom research paper on any topic and get your high quality paper at affordable price.
ORDER HIGH QUALITY CUSTOM PAPER

Always on-time

Plagiarism-Free

100% Confidentiality
