
This sample Crime Mapping Research Paper is published for educational and informational purposes only. If you need help writing your assignment, please use our research paper writing service and buy a paper on any topic at affordable price. Also check our tips on how to write a research paper, see the lists of criminal justice research paper topics, and browse research paper examples.
Overview
Crime mapping is the direct application that comes from considering two particular characteristics about crime – it has an inherent geographical quality and crime does not happen randomly. That is, all crime occurs at some location, and it is the features of this location and the nature of the crime that has been committed, including the decision-making of an offender and their interaction with a victim (or other target such as a building), that make the study of its geography useful for law enforcement and public safety. This can include responding to calls for service, identifying crime hot spots, and supporting the investigation of a crime series.
This section begins by discussing the fundamental theoretical principles that underpin crime mapping, offers a brief history of its development, and then illustrates examples of its application. The final section identifies future directions for its development.
Theoretical Fundamentals
The inherent geographical quality of crime can be observed in many theoretical forms. For example, the four dimensions of crime state that for a crime to occur it must have a legal dimension (a law must be broken), a victim dimension (someone or something has to be targeted), an offender dimension (someone has to do the crime), and a spatial dimension (it has to happen somewhere) (Brantingham and Brantingham 1981). This therefore highlights the value that an assessment of the location of the crime can play, alongside the study of the offender and their behavior, and the vulnerability of the person or property that was targeted.
The nonrandom geographical nature to crime can also be explained theoretically by drawing from Routine Activity Theory, Rational Choice Theory, Crime Pattern Theory, and principles of least effort. Routine Activity Theory (Cohen and Felson 1979) states that for a crime to occur, three components must be present. There must be the presence of a likely offender, the presence of a suitable target, and the absence of a capable guardian. These three components must meet in time and space, to formulate the necessary “chemistry” for crime (Felson 1998). Routine Activity Theory therefore states that the risk of crime changes over time with the movement of people throughout their daily routine activities, meaning that the geography relating to these activities helps to determine features relating to victim vulnerability and offender motivation. Most researchers take the existence of likely offenders as a constant in our society and attempt to explain and prevent crime by examining the two remaining components. Victim and target suitability can change over space and time, and the possibilities for introducing suitable guardianship into an area as a way to prevent crime, or to make existing guardians more suitable, offer a means for considering ways for reducing crime opportunities. The consideration of these three components of crime has recast Routine Activity Theory into the Crime Problem Analysis Triangle (Eck 1995) – stating that all crime problems have an offender, victim, and a place component (incorporating both the geographical location and temporal features of the crime), with the notion of guardianship in this model acting as a handler to help reduce the vulnerability of the victim or target.
Rational Choice Theory (Clarke and Felson 1993) provides a framework to consider offender decision-making (and its relationship with space) when a crime opportunity is presented. That is, the commission of crime by a person is a (fairly) rational decision, with the aim being to achieve some sort of desire or goal. This goal may be to derive personal financial gain (e.g., as in a theft of cash), personal pleasure (e.g., stealing a car for joyriding), or through the imposition of power (e.g., through the extension of bullying by stealing possessions off a person or through violence). This criminal decision-making is considered to involve two parts. There is a long-term, multistage decision to become generally involved in criminal activity (criminal involvement decision) and a shorter-term, more immediate decision (the criminal event decision) to grasp an opportunity that is presented (Cornish and Clarke 1986). In a geographical sense, factors relating to social and economic disadvantage and social disorganization (Burgess 1925; Shaw and McKay 1942) may have a role to play in the long-term decision-making process, whereas the immediate decision-making of an offender is primarily based on the environmental cues from the prospective target that can change from place to place.
Crime Pattern Theory provides a useful convergence of Routine Activity Theory and Rational Choice Theory by helping to explain the geographical behavior of an offender, their interaction with potential targets, and offense distribution. That is, it helps examine the “relationship of the offence to the offender’s habitual use of space” (Bottoms and Wiles 2002, p. 638). Crime Pattern Theory suggests that offenders are influenced by the daily activities and routines of their lives, so that even if they are searching for a criminal opportunity, they will tend to steer toward areas that are known to them (Brantingham and Brantingham 1984). In their day-to-day activities, they will be watching for targets that have no guardians or place managers (Eck 1995). Crime Pattern Theory considers the notion of awareness space (the areas that are familiar, through carrying out routine activities in these areas), opportunity space (those places which offer a target-rich environment, i.e., where there is a concentration of suitable targets), and the places where these two overlap. This is illustrated in Fig. 1, showing a hypothetical model of an offender’s awareness space (consisting mainly of the places they routinely frequent and the routes between these places) and the overlap with opportunities for crime. For this offender, they are most likely to commit crime in those locations where their awareness space and the opportunity space overlap. The opportunity space extends to areas outside of their awareness, but for this offender, crime that they commit is unlikely in these areas because they are not familiar with the opportunities, nor comfortable with the higher risk taking that may be involved (i.e., lack of familiarity of escape routes and a higher perceived risk of being caught).
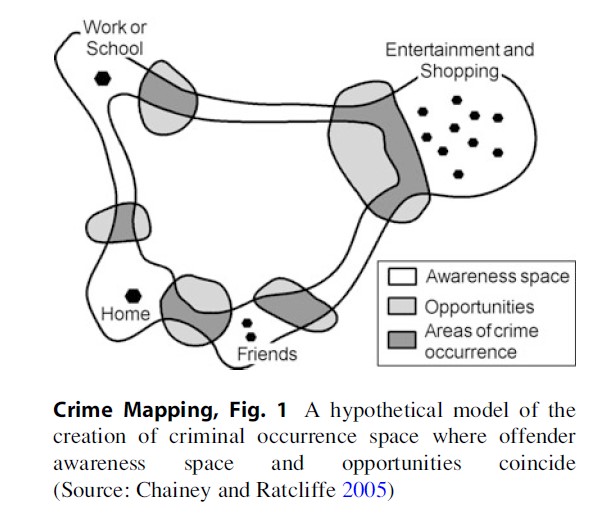 Crime Mapping, Fig. 1 A hypothetical model of the creation of criminal occurrence space where offender awareness space and opportunities coincide (Source: Chainey and Ratcliffe 2005)
The final fundamental theoretical consideration behind crime mapping is the least effort principle. This states that most journeys we take in our daily activities are short and that the frequency of these activities decays with distance. That is, while we may make long distances to carry out activities, the majority of things we do involve us seeking out trips that minimize this distance. For instance, we may need a carton of milk. While there are many places that sell milk, most people will purchase milk by going to a local store, rather than expending additional effort and travelling to a store some additional distance away. This least effort principle is also evident with offending behavior. Research into offenders’ journeys to crime shows that the majority of trips are short (within a few miles) (see Rossmo 2000 for a comprehensive review of journey to crime literature). This concept is also captured in Fig. 1 through the illustration of boundaries to the awareness space. If there was no concept of the least effort principle, the awareness space would extend to infinity in all directions.
These theoretical principles provide the backdrop to the application of crime mapping. However, while these theories help to conceptualize the spatial behavior and interaction between offenders and their targets, there will always be exceptions, e.g., an offender may not commit crime within their own awareness space due to the influence of peers who introduce the offender to new areas. For the majority of offenders, broad behavioral tendencies do exist and can be explained as aggregate criminal spatial behavior. Crime mapping therefore draws from geographical and environmental criminology concepts to help explain why crime occurs, and makes use of geospatial tools (such as Geographical Information Systems – GIS) to capture, analyze, and visually interpret these geographical qualities. Examples of its application are provided in a following section. Before this a short history of GIS and crime mapping is provided to help capture how its use has evolved.
GIS And A Brief History Of Crime Mapping
A GIS is “a computer system for capturing, managing, integrating, manipulating, analysing and displaying data which is spatially referenced to the Earth” (McDonnell and Kemp 1995, p. 42). A GIS provides the computing environment within which crime data can be layered with base maps and other geographic data that relate to the landscape and conditions of the area under study. This other geographic information may include population data from a census, the locations of bars and nightclubs, or data describing the local land use patterns. These data can be represented as individual layers that can be manipulated, analyzed, or displayed as separate entities, or could be combined with other layers to be displayed together, integrated to provide a new perspective of the area that they represent, or analyzed against each other to explore relationships.
GIS began to emerge as a discipline in the 1960s, with its origins being in the development of land use applications in Canada, growing then through applications that included the automation of the cartographic drafting process used by mapping agencies such as the British Ordnance Survey and acting as a platform to aid military intelligence gathering, display and analysis from satellite, and other remote sensing imagery (e.g., aerial photography and radar). The use of GIS in policing did not begin to emerge until the 1980s, in large part due to computer hardware prices being too prohibitively expensive before this time, the lack of suitable GIS software that could be used to support policing requirements, and the lack of electronic recording of police records. Even then, it took until the late 1990s for the use of GIS in policing to gather pace, mainly due to being held back by organizational and management problems, issues with sharing information, technical problems, and geocoding issues (see Chainey and Ratcliffe 2005 for a more detailed assessment). Many of these problems are still apparent today, but through developments in the practical use of GIS, several innovators have identified how these can be overcome, and have shared this knowledge across a network of users who engage via forums, conferences, training courses, and publications that since 1998 have begun to capture evidence of how crime mapping can be effectively used to support policing and crime prevention.
Crime Mapping Applications
Crime mapping contributes to policing, law enforcement, and crime reduction by helping to generate a real understanding of criminal activity and the direction in tackling it (Chainey and Ratcliffe 2005). The further reading section provides details of many examples that have captured its operational use – both for tactical and strategic purposes. In this section, examples of its use are provided relating to several of the main operational functions in law enforcement and public safety:
- Performance and accountability – CompStat
- Response – directing calls for service
- Prevention – the analysis of crime hot spots
- Detection – geographic profiling
- Evaluation – through the use of analysis that explores the impact, displacement, and diffusion of benefit from a geographically targeted policing or crime prevention initiative.
Performance And Accountability: Compstat
CompStat (short for Computer Statistics) is an operational management process that combines computer technology, operational strategy, and managerial accountability to determine the provision of crime reduction policing (Walsh 2001). From its early origins with the New York City Police Department, the CompStat idea has been adopted in many police agencies across the world. Figure 2 captures the CompStat process in operation at Thames Valley Police Force in England.

The basic aim of CompStat is to provide detailed intelligence to operational commanders on a regular basis so that they can determine an appropriate crime reduction and law enforcement strategy and then subsequently be held accountable for the success of the strategy. The computer system to analyze and map crime patterns is at the core of the CompStat process (Walsh 2001, p. 352). Crime maps form a useful basis around which those in attendance can visualize operational decisions, resource allocation, and managerial accountability. This can include the use of live and interactive crime mapping as a way to help focus and direct discussions around particular problems, deployed tactics, and performance in relation to the current local crime reduction priorities.
Response: The Use Of GIS For Calls For Service
Pinpointing the location of an incident and ensuring that it is identified with minimal ambiguity is vital for a quick and direct response. Many police agencies use gazetteers that are integrated into their mapping systems to search for and view the location of an incident when a call comes in to their command and control center. Increasingly, police forces are also utilizing Global Positioning Systems (GPS) to provide a real-time link to the command center to show the location and details of response teams that are on patrol (e.g., see Home Office 2005). The use of mobile computing technology also helps police agencies organize responses to incidents. In-car computer technology has become the norm in law enforcement agencies in the United States, permitting live access to central databases, allowing for the display of recent events, and permitting the recording of details about incidents while on out on patrol.
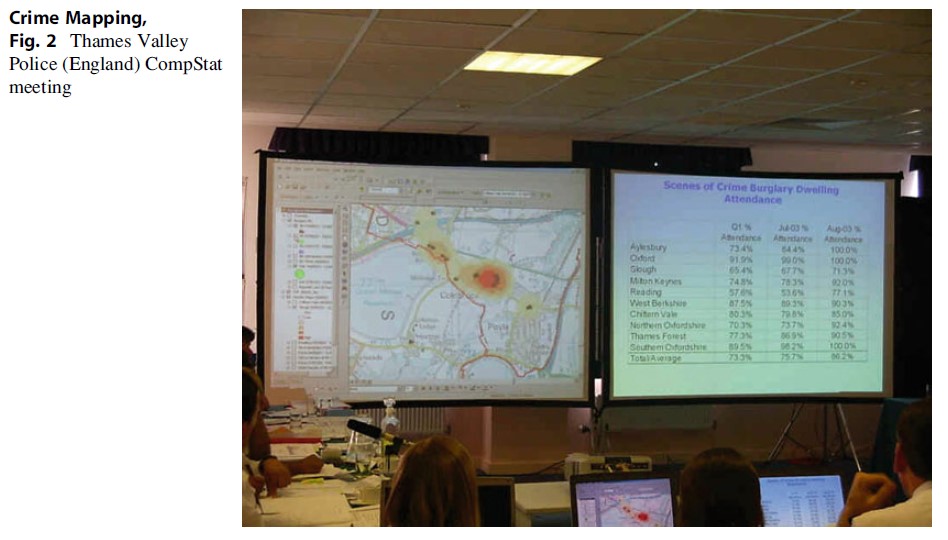 Crime Mapping, Fig. 2 Thames Valley Police (England) CompStat meeting
Crime Prevention: Hot Spot Analysis
Hot spot mapping is a popular analytical technique used by law enforcement, police, and crime reduction agencies to visually identify where crime is highest, aiding decision-making that determines where to target and deploy resources. Its application has been used to support the operational briefing of police patrols (Home Office 2005; LaVigne and Wartell 2000; Harries 1999), informs the creation of intelligence products and problem solving (Home Office 2005; Chainey and Ratcliffe 2005), has been used as a tool to capture the measurement and analysis of crime patterns for crime auditing purposes in the UK’s crime reduction partnerships (Chainey and Ratcliffe 2005; Chainey 2001), and supports performance analysis (e.g., see Chainey and Ratcliffe 2005; Home Office 2005; Walsh 2001). In essence, hot spot mapping is a technique that is used to help determine where crime may happen next, using data from the past to inform future actions. In this sense it acts as a basic technique for predicting where crime may occur, using the premise that retrospective patterns of crime are a useful indicator for future patterns.
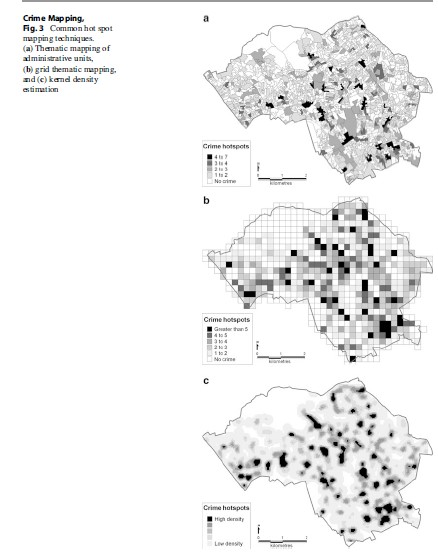
There are many different mapping techniques that can be used for identifying and exploring patterns of crime. Attempting to do this via point mapping has become outdated since the proliferation of GIS software and the increasing sophistication of mapping techniques. Three of the most common techniques include the following:
- Thematic mapping of geographic administrative areas (also referred to as choropleth mapping): this approach uses geographic units that are defined for administrative or political use (e.g., police beats, census blocks, wards, or districts). Crimes that are geographically referenced as points can be aggregated to these geographic unit areas and then shaded in accordance with the number of crimes that fall within them. These types of maps are quick to produce and allow for additional information relating to the geographic unit (such as population) to be linked to explore relationships or calculate a crime rate – increasing their versatility for analysis. However, the varying size and shape of most geographical boundaries can lead the map reader to misinterpret the true distribution of crime due to issues associated with the distribution of crime across the geographical division of boundary areas (Chainey and Ratcliffe 2005) and due to issues associated with the Modifiable Areal Unit Problem (MAUP). This is where changes in the boundaries themselves can directly affect the patterns shown on the map. Thematic mapping of boundary areas continues to see widespread application, from being used for comparing the different volumes of unique and repeat burglaries across a study area’s census zones (Ratcliffe and McCullagh 2001) to being used for comparing vehicle theft in relation to land use in Overland Park, Kansas (Harries 1999, p. 47). An example of a thematic map, generated for census areas, is shown in Fig. 3a.
- Grid thematic mapping: in order to address the problems associated with different sizes and shapes of geographical regions, uniform grids can be drawn in a GIS and used as the unit of aggregation for point geo-referenced data (see Fig. 3b). This approach does have some limitations (e.g., it suffers from the same MAUP problems outlined above), but its use has been illustrated for identifying vulnerable residences where target hardening was then implemented (Bowers et al. 2001) and for mapping the volume of emergency calls and violent offenses per square mile in North Carolina (LeBeau 2001).
- Kernel density estimation: this technique has become increasingly popular due to its now wide availability in standard GIS software products, its accuracy for hot spot identification (Chainey et al. 2008), and the aesthetic look of the resulting map in comparison to other techniques (Eck et al. 2005). Point data (offenses) are aggregated within a user-specified search radius and a continuous surface that represents the density of crime events is calculated. A smooth surface map is produced, showing the variation of the crime density across the study area, with no need to conform to geometric shapes such grid units. Examples of the use of KDE are now widespread, with popular crime mapping texts showing its use for a variety of applications (see Chainey and Ratcliffe 2005; Eck et al. 2005; Harries 1999). An example of a KDE crime hot spot map is shown in Fig. 3c.
The use of hot spot analysis continues to advance, particularly in terms of exploring how geographic information that represents the underlying causal factors of crime can be modeled alongside recorded incidents of crime. Risk Terrain Modeling is one of these techniques and involves combining separate layers of risk variables (e.g., transport termini, schools, bars, and nightclubs) to produce a composite map showing the presence, absence, or intensity of all risk factors across a study area (Kennedy et al. 2011).
Detection: Geographic Profiling
Geographic profiling is an investigative technique that uses the locations of a linked series of crimes to determine the most probable area of offender residence (Rossmo 2000). Geographic profiling is a method of strategic information management that prioritizes the offender search efforts to maximize the efficiency of serial crime investigations. Until recently, this technique’s application has very much focused on serious violent or sexual crimes such as rape and murder. However, it is also now more widely applied to nonviolent, high-volume crime (e.g., criminal damage and burglary) where a series is evident.
Geographic profiling is based on research from the fields of criminology, geography, forensic and environmental psychology, mathematical modeling, statistical analysis, and criminal investigation. In a criminal context, each site associated with a single offender (e.g., victim encounter site and attack site) represents a location that is most likely to be present within the offender’s awareness space. Using a series of sites linked to the same offender, a probability map can be constructed that predicts the location of an offender’s anchor point – usually the offender’s residence. A geographic profile is constructed using a mathematical algorithm that models the offender’s likely journey to crime distances and the relationship between crime location sets and offender residence. The process assigns scores to the various points on a map that represent the offender’s hunting area. These scores are based on the crime site locations and certainty in the linkages between crimes. The map output of a geographic profile identifies the most probable area of offender residence. The geographic profile can then be used to help recommend investigative strategies that will support the detection of the offender. This could include suspect prioritization based on the cross-referencing of the geographic profile with suspect lists, the targeting of DNA swabbing, or patrol saturation and operational stakeouts. Daniell (2008) provides an example that illustrates the use of geographic profiling that led to catching a serial sex offender in Bath, England.
 Crime Mapping, Fig. 3 Common hot spot mapping techniques. (a) Thematic mapping of administrative units, (b) grid thematic mapping, and (c) kernel density estimation
Evaluation
Many crime prevention initiatives and police operations are area-based: resources are targeted to a particular area in an attempt to deal with its crime problems. Crime mapping offers a useful tool to help monitor if the initiative or operation has been a success by analyzing the before and after picture of the crime levels in the area. With the use of techniques such as the Weighted Displacement Quotient (Bowers and Johnson 2003), an analysis can also be conducted to discover if there has been any displacement or diffusion of benefit as a result of an area-based targeted initiative. For example, in an analysis of alley-gating schemes in Merseyside, England (involving the installation of security gates across alleyways or footpaths that run behind properties), Bowers et al. (2004) used concentric buffer rings around the alley-gating areas to explore if and how far any burglary was displaced (see Fig. 4). The results showed there to be a diffusion of benefit to properties in the surrounding areas. The evaluation also enabled a rudimentary cost-benefit analysis to be calculated, showing that in the areas where the gates had been installed, the cost-benefit ratio was around 1.86 (i.e., a saving of £1.86 for every pound spent).
Future Directions
Advances in computing technology come with it opportunities to apply more sophisticated analysis of geographical patterns and apply new technology that supports improvements in policing, law enforcement, and crime prevention. For example, greater use of Internet-based crime mapping tools can help support the publication of neighborhood-level crime statistics to the public to provide positive messages of reassurance and alert residents to spates of crime in their neighborhood that may place them at a heightened risk of being victimized and the precautions they can take to minimize this risk (Chainey and Tompson 2012).
To date, geographical analysis of crime patterns in policing has focused on the generation of descriptive material that helps to identify geographical patterns of crime (such as crime hot spots), but has yet to fully embrace more sophisticated forms of geographical information analysis. New developments that are expected in crime mapping include the following:
- Analysis of the significance of geographical patterns – spatial significance testing identifies geographical patterns that are considered to be particularly unusual by applying the principles of significance testing (e.g., see Chainey 2011).
- A harmonization of the geographical and temporal exploration of crime, so that each is explored together and as a continuum rather than in isolation.
- The development of local spatial regression techniques to help examine relationships between crime patterns and other variables – to explain why crime occurs at certain places.
- The development of techniques that predict where and when crime will occur in the future.
- Spatial modeling processes that test “what if” scenarios such as examining the impact that a crime prevention initiative may have on crime levels (e.g., see Birks et al. 2012).
Crime Mapping, Fig. 4 Alley-gated areas in Merseyside and concentric buffers used to detect displacement or diffusion of benefit (Source: Bowers et al. (2004))
Bibliography:
- Birks D, Townsley M, Stewart A (2012) Generative explanations of crime: using simulation to test criminological theory. Criminology 50(1):221–225
- Bottoms AE, Wiles P (2002) Environmental criminology. In: Maguire M, Morgan R, Reiner R (eds) The oxford handbook of criminology. Oxford University Press, London, pp 620–656
- Bowers K, Johnson SD (2003) Measuring the geographical displacement and diffusion of benefit effects of crime prevention activity. J Quant Criminol 19(3): 275–301
- Bowers K, Newton M, Nutter R (2001) A GIS-linked database for monitoring repeat domestic burglary. In: Hirschfield A, Bowers K (eds) Mapping and analysing crime data – lessons from research and practice. Taylor and Francis, London
- Bowers KJ, Johnson SD, Hirschfield AFG (2004) Closing off opportunities for crime: an evaluation of alley-gating. Eur J Criminal Policy Res 10:285–308
- Brantingham PJ, Brantingham PL (1981) Environmental criminology. Waveland Press, Prospect Heights
- Brantingham PJ, Brantingham PL (1984) Patterns in crime. Macmillan, New York
- Burgess EW (1925) The growth of the city: an introduction to a research project. In: Park RE, Burgess EW, McKenzie RD (eds) The city. University of Chicago Press, Chicago, pp 47–62
- Chainey SP (2001) Combating crime through partnership; examples of crime and disorder mapping solutions in London, UK. In: Hirschfield A, Bowers K (eds) Mapping and analysing crime data – lessons from research and practice. Taylor and Francis, London
- Chainey SP (2011) Advanced hotspot analysis – spatial significance mapping using the Gi* statistic. In: Presentation at the 2011 international crime and intelligence analysis conference. Available at: http://www.ucl.ac.uk/jdi/events. Accessed 17 Apr 2012
- Chainey SP, Ratcliffe JH (2005) GIS and crime mapping. Wiley, London
- Chainey SP, Tompson L (2012) Engagement, empowerment and transparency: publishing crime statistics using online crime mapping. Policing J Policy Pract
- Chainey SP, Tompson L, Uhlig S (2008) The utility of hotspot mapping for predicting spatial patterns of crime. Security J 21:4–28
- Clarke RV, Felson M (eds) (1993) Routine activity and rational choice. Advances in criminological theory, vol 5. Transaction Books, New Brunswick, NJ
- Cohen LE, Felson M (1979) Social change and crime rate trends: a routine activity approach. Am Sociol Rev 44:588–608
- Cornish D, Clarke R (1986) The reasoning criminal: rational choice perspectives on offending. Springer, New York
- Daniell C (2008) Geographic profiling in an operational setting: the challenges and practical considerations, with reference to a series of sexual assaults in Bath, England. In: Chainey SP, Tompson L (eds) Crime mapping case studies: practice and research. Wiley, Hoboken
- Eck J (1995) A general model of the geography of illicit retail marketplaces. In: Weisburd D, Eck JE (eds) Crime and place. Criminal Justice Press, New York, pp 67–93
- Eck JE, Chainey SP, Cameron JG, Leitner M, Wilson RE (2005) Mapping crime: understanding hot spots. National Institute of Justice, USA. Available online at www.ojp.usdoj.gov/nij
- Felson M (1998) Crime and everyday life: impact and implications for society. Pine Forge Press, Thousand Oaks
- Harries K (1999) Mapping crime: principle and practice. United States National Institute of Justice, Washington, DC. Available online at http://www.ojp.usdoj. gov/nij/maps/pubs.html
- Home Office (2005) Crime mapping: improving performance. Home Office Police Standards Unit, London. http://www.ucl.ac.uk/scs/people/academicresearch-staff/spencer-chainey/Slides/Home_Office_ CrimeMapping. Accessed 17 Apr 2012
- Kennedy LW, Caplan JM, Piza E (2011) Risk clusters, hotspots, and spatial intelligence: risk terrain modeling as an algorithm for police resource allocation strategies. J Quant Criminol 27(3):339–362
- LaVigne N, Wartell J (eds) (2000) Crime mapping case studies: successes in the field, vol 2. Police Executive Research Forum, Washington, DC
- LeBeau JL (2001) Mapping out hazardous space for police work. In: Bowers K, Hirschfield A (eds) Mapping and analysing crime data – lessons from research and practice. Taylor and Francis, London
- McDonnell R, Kemp K (1995) International GIS Dictionary. GeoInformation International, Cambridge, UK
- Ratcliffe J, McCullagh M (2001) Crime, repeat victimisation and GIS. In: Bowers K, Hirschfield A (eds) Mapping and analysing crime data – lessons from research and practice. Taylor and Francis, London, pp 61–92
- Rossmo DK (2000) Geographic profiling. CRC Press, Boca Raton
- Shaw CR, McKay HD (1942) Juvenile delinquency and urban areas. University of Chicago Press, Chicago
- Walsh WF (2001) Compstat: an analysis of an emerging police managerial paradigm. Policing An Int J Police Strat Manage 24(3):347–362
See also:
Free research papers are not written to satisfy your specific instructions. You can use our professional writing services to buy a custom research paper on any topic and get your high quality paper at affordable price.
ORDER HIGH QUALITY CUSTOM PAPER

Always on-time

Plagiarism-Free

100% Confidentiality
