
This sample Randomized Response Methods Research Paper is published for educational and informational purposes only. If you need help writing your assignment, please use our research paper writing service and buy a paper on any topic at affordable price. Also check our tips on how to write a research paper, see the lists of criminal justice research paper topics, and browse research paper examples.
In survey research it is often problematic to ask people sensitive questions because they may refuse to answer or they may provide a socially desirable answer that does not reveal their true status on the sensitive question. To solve this problem Warner (1965) proposed randomized response (RR). Here a chance mechanism hides why respondents say “yes” or “no” to the question being asked.
Thus far RR has been mainly used in research to estimate the prevalence of sensitive characteristics. RR can be used in, for example, self-report studies on criminal behavior (compare, e.g., the two meta-analyses in Lensvelt-Mulders et al.2005). In the Netherlands, much research has been funded by the Expert Centre for Law Enforcement of the Ministry of Justice in the area of regulatory noncompliance in areas as the taxi-driving law, under regulations for food retailers, the law of individual rent subsidy, and the law on agricultural chemicals. Elffers et al. (2003) give an overview of early research in this area. This line of research has been fine-tuned in research funded by the Dutch Ministry of Social Affairs and Employment on regulatory noncompliance among receivers of benefits (compare Lensvelt-Mulders et al. 2006, for a “best practice”). Typically, in this line of research the survey consists of RR questions on sensitive behavior and questions that may explain the psychological and background characteristics of respondents who are more likely to indulge in this behavior. Elffers et al. provide a theoretical background for the development of the psychological characteristics that they coin the table of eleven, as there are 11 explanatory areas.
It is not uncommon that researchers wrongly believe that the RR procedure has the drawback that it is not possible to relate the sensitive characteristics to explanatory variables. However, statistical tools have been developed to relate the sensitive variables to explanatory variables. Univariate RR data can be analyzed with a version of logistic regression that is adapted so that it can handle data collected by RR. Multivariate dichotomous RR data can be handled using a model from item response theory that assumes a latent variable that explains the answers on the RR variables. This research paper ends with a discussion of a recent development in the analysis of multivariate RR data, namely, models that take into account that there may be respondents that do not follow the instructions of the RR design by answering no whatever the sensitive question asked.
Introduction
Is it possible to measure sensitive behavior such as noncompliance with rules and regulations that govern public life using surveys? Because it is well known that questions about compliance behavior with rules and regulations may not yield truthful responses, the randomized response (RR) method has been proposed as a survey tool to obtain more honest answers to sensitive questions (Warner 1965). In the original RR approach, respondents were provided with two statements, A and B, with statement A being the complement of statement B. For example, statement A is “I used hard drugs last year” and statement B is “I did not use hard drugs last year.” A randomizing device, for instance, in the form of a pair of dice determines whether statement A or B is to be answered. The interviewer records the answer “yes” or “no” without knowing the outcome of the randomizing response device. Thus, the interviewee’s privacy is protected but it is still possible to calculate the probability that the sensitive question (A and not B) is answered positively.
Meta-analyses have shown that RR methods can outperform more direct ways of asking sensitive questions (Lensvelt-Mulders et al. 2005). Importantly, the relative improvements in validity increased with the sensitivity of the topic under investigation. This research paper will show recent developments of in the analysis of RR data, focusing on regression models relating the sensitive question(s) measured with RR to explanatory variables, and models that take into account that there may be respondents that do not follow the instructions of the RR design by answering no whatever the sensitive question asked.
In this manuscript the examples stem from surveys conducted for the Dutch government on noncompliance in social welfare (Lensvelt-Mulders et al. 2006). In the Netherlands Dutch employees must be insured under the Sickness Benefit Act, the Unemployment Insurance Act, the Health Insurance Act, and the Invalidity Insurance Act. Under each of these acts, an (previously) employed person is eligible for financial benefits provided certain conditions are met.
Most of the examples focus on six RR questions, four of which are health-related and the remaining two are work-related. The health questions are:
- Have you been told by your physician about a reduction in your disability symptoms without reporting this improvement to your social welfare agency?
- On your last spot-check by the social welfare agency, did you pretend to be in poorer health than you actually were?
- Have you noticed personally any recovery from your disability complaints without reporting it to the social welfare agency?
- Have you felt for some time now to be substantially stronger and healthier and able to work more hours, without reporting any improvement to the social welfare agency?
The work-related questions are:
- In the last 12 months have you moonlighted while receiving your IIA benefits?
- In the last 12 months have you taken on a small job alone or together with your friends that you got paid for without informing the social welfare agency?
The remainder of this research paper is structured as follows. First the analysis of RR data without explanatory variables is discussed. Next, logistic regression adjusted for univariate RR data is described. After this the analysis of multivariate RR data is discussed. This section discusses how regression approaches are to be adjusted in the light of new models that take into account the fact that part of the sample may not be following the RR instructions laid out by the researcher.
Models For Randomized Response Data
Univariate Rr Data, No Explanatory Variables
This section discusses the analysis of univariate RR data, where no explanatory variables are involved. The forced response design (Boruch 1971) is used as an example of an RR design.
Assume that the sensitive question asks for a “yes” or “no” answer. The forced response design is as follows. After the sensitive question is asked, the respondent throws two dice and keeps the outcome hidden from the interviewer. If the outcome is 2, 3, or 4, the respondent answers yes. If the outcome is 5, 6, 7, 8, 9, or 10, the respondent answers according to the truth. If the outcome is 11 or 12, the respondent answers no. Let Y be the latent binary RR variable that denotes the true status on the sensitive item, and let Y* be the observed RR variable that denotes the observed answer on the randomized sensitive question, with “yes” = 1 and “no” = 2. Then
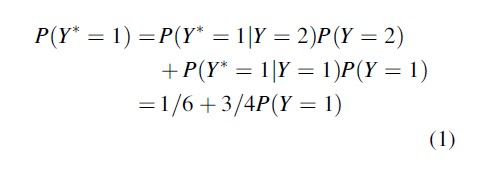
By writing P(Y* = j) = c + dP(Y = 1), other designs can be described in the same way (compare Bockenholt and van der Heijden 2007). As a first example, in the original Warner design an individual is allocated to either statement A, with probability p, or to statement B, with probability 1-p, with p≠.5. The sensitive question in group A is “do you belong to the sensitive population?” and in group B “do you not belong to the sensitive population?” Now c = (1-p) and d = (2p-1). A second example is the Kuk (1990) design (see van der Heijden et al. 2000, for an application). Here a (indirect) “yes” or “no” question is asked using two decks of cards with red and black cards. In the right deck the proportion of red cards is 8/10, while in the left deck it is 2/10. The respondent is asked to draw one card from each deck and keep the color of the cards hidden from the interviewer. Next, the question is asked. Instead of answering the question directly, the respondent names the color of the card he took from the related deck, that is, when the answer is “yes,” the respondent names the color of the card he took from the right stack (thus, red is associated with “yes”), and when the answer is “no,” he names the color of the card from the left stack (thus, black is associated with “no”). In this case we have c=1/5 and d =3/5.
The estimation of P(Y=1) in Eq. 1 is straightforward when the parameters are in the interior of the parameter space. If the estimate of P(Y=1) is between 0 and 1, then solving Eq. 1 provides so-called unbiased moment estimates. These moment estimates are equal to the maximum likelihood estimates (MLEs). It is however possible that the moment estimates are outside the unit interval, for example, when the observed proportion in the data is lower than 1/6 (chance level). In that case the MLEs are set to 0. See van der Hout and van der Heijden, 2002, for a detailed discussion.
Extended introductions can be found in Fox and Tracy (1986), Chaudhuri and Mukerjee (1988), and Chaudhuri (2011).
Example
In the 2002 survey 1,760 recipients of disability benefits were asked the six RR questions as presented above using the Kuk method. The respective point estimates with 95 % bootstrap confidence intervals for the four health items are .03 (.004–.052), .04 (.012–.061), .07 (.046–.098), and .13 (.102–.156). For the two work items the respective estimates are .16 (.128–.184) and .08 (.050–.103).
Univariate RR Data And Explanatory Variables
In logistic regression the dependent variable is predicted from one or more covariates. The logistic regression model for RR data is given by
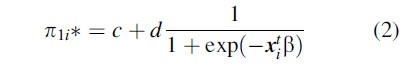

π1i* is the probability that individual i has score Y = 1, xi the vector with the covariate scores of individual i, and β the corresponding vector with regression parameters.
The outcome of the RR logistic regression procedure can be interpreted in the usual way (see, e.g., Agresti 2002). The β-parameters reveal the relation between the covariates and the probability of a sensitive true status, and the significance of each parameter can be assessed using Wald tests. Chi-square tests can be used to assess the fit of the model if the observed RR data are counts that allow comparison with fitted values under the RR logistic regression model, and differences between models can be tested using likelihood ratio chi-square tests.
An early reference to logistic regression for RR data is Maddala (1983, pp. 54–56), and an elaborate discussion can be found in Scheers and Dayton (1988). Lensvelt-Mulders et al. (2006) extend the logistic regression procedure so that it can incorporate person weights that make it possible to weight a sample toward population characteristics, if known.
Example
As an illustration an example taken from Lensvelt-Mulders et al. (2006) is reported. The dependent variable is the work item “In the last 12 months have you taken on a small job alone or together with your friends that you got paid for without informing the social welfare agency?” The explanatory variable is “I think it is more beneficial for me not to follow the rules connected to my disability insurance benefit,” abbreviated as “benefit,” that is measured on a five-point scale and has a mean of 3.67 and a standard deviation of.777. Many more explanatory variables have been measured in this survey, motivated from a rational choice framework; see Lensvelt-Mulders et al. (2006) and Elffers et al. (2003) for details.
The logistic regression model logit (noncompliance) = constant + b * benefit has estimates .765 for the constant and .751 for b. In order to study the impact of these estimates, the estimated probability of noncompliance for the mean value of benefit (i.e., 3.67) and the mean plus or minus one standard deviation (i.e., 3.67 +.78 = 4.45 and 3.67 -.78 = 2.89) are compared. For the mean value of benefit, the estimated probability of noncompliance is 12 %, for 4.45 the estimated probability is 20 %, and for 2.89 the estimated probability is 7 %. This shows that benefit has a strong relation with the decision not to comply with the above disability insurance benefit regulation: the more profitable people perceive that noncompliance is, the more often they do not comply with this work regulation.
Multivariate RR Data
The data from multiple RR items can also be modeled with item response models. The simplest version of this class of models is the Rasch model (Rasch 1980). For RR data, this model is given by
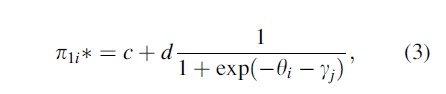
(see Bockenholt and van der Heijden 2004, 2007; Fox 2005). In this model, the parameter yj captures the sensitivity of item j, and the parameter θi captures the propensity of the individual i to comply with social security regulations. Since the precision in estimating individual differences in rule compliance is a function of the number of RR items per respondent, more precise measures of compliance can be obtained in multiplethan in single-item studies for equal sample sizes.
Second, mixture versions of the IRR models are developed to allow for respondents who do not follow the RR instructions. Thus, one mixture component consists of respondents who answer RR items by following the RR design and the other component consists of respondents who do not follow the RR design by saying “no” to each RR item, irrespective of the outcome of the randomizing device. These are called “self-protective” (SP) responses. By allowing for the possibility that not all respondents may follow the RR instructions, substantially higher estimates of noncompliance are found than the estimates obtained with current RR methods.
Example
Table 1 reports the goodness-of-fit statistics obtained from fitting the IRR models to the work and health items for the 2002 and 2004 surveys. Fit statistics obtained when considering the health items only are also included. Because a minimum of three items is needed to identify an IRR model without covariates, IRR models are not estimated separately for two work items. The first set of fitted models is based on the baseline RR assumptions represented by Eq. 1 and serves as a benchmark for the (mixture-) IRR models. The second part of Table 1 is obtained by fitting a Rasch version of Eq. 3 to the health item set and by fitting a multidimensional Rasch version of Eq. 3 to both item sets simultaneously.
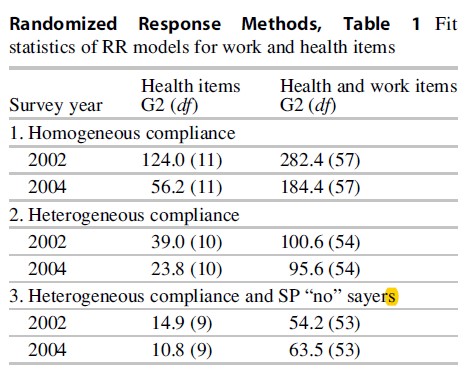
The homogeneous-compliance models require the estimation of two- and six-item location parameters when applied to the four health items and the four health and two work items, respectively. None of the reported fits are satisfactory, indicating that the assumption of no individual differences does not agree with the data. This result is supported by the fit improvement obtained from the IRR models that allow for heterogenous compliance behavior without requiring item- specific discrimination parameters. With one additional parameter for the health items and three additional parameters for the bivariate covariance matrix of the health and work items, these IRR models imply major fit improvements. However, despite the better fit, these models still do not describe the data satisfactorily.
As shown by a residual analysis of the data, the main reason for the misfit is that the outcome of self-protective responses (i.e., consistent “no” responses to the items) is greatly underestimated by these models. Thus, more respondents than expected under the IRR models give exclusively “no” responses when asked questions about their compliance with the health and work regulations. A mixture component can address the problem of extra “no” responses. The models’ parsimonious representation appears to be in good agreement with the 2002 and 2004 survey data as indicated by the fit statistics in Table 1.
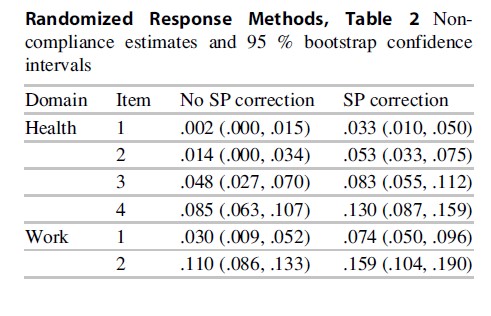
Most importantly, the mixture-IRR models provide more accurate estimates of the noncompliance rate in the population of interest than RR methods that do not allow for response biases. Table 2 contains the noncompliance estimates and their 95 % bootstrap confidence intervals obtained under both the homogeneous compliance model without a response bias correction and under a mixture model for the response bias correction. For example, for the health domain, the bias-uncorrected noncompliance percentages for the four items are estimated as 0.2 %, 1.4 %, 4.8 %, and 8.5 %, respectively. In contrast, in the model with the mixture component, the corresponding estimates are 3.3 %, 5.3 %, 8.3 %, and 13.0 %. These differences are substantial and demonstrate the value of the proposed approach for the analysis of RR data. By not taking into account possible response biases, the incidence of noncompliance is severely underestimated. It should be noted that these estimates do not include the mixture component consisting of the SP respondents. Thus, it is possible that even the response bias-corrected estimates are too low if some or all of the SP respondents are noncompliant as well.
Future Directions
Despite the fact that the respondents’ privacy is protected by the RR design, it is not always perceived as such by the respondents. Because RR forces respondents to give a potentially self-incriminating answer for something they did not do, it is susceptible to self-protective responses (SP), that is, respondents answer “no” although they should have responded “yes” according to the randomizing device (see, e.g., Edgell et al. 1982). The online questionnaires used were designed in such a way that the outcome of the dice is not recorded and this was mentioned in the instructions given to the respondents. As a result, the respondents were free to give a different answer than the forced “yes” or “no” induced by the dice. Although RR performs relatively well, by eliciting more admittances of fraud than direct-questioning or computerassisted self-interviews (Lensvelt-Mulders et al. 2005), noncompliance probabilities might still be underestimated if SP is not taken into account.
Recently, several studies have focused on the detection or estimation of SP when RR methods are used. Clark and Desharnais (1998) showed that by splitting the sample into two groups and assigning each group a different randomization probability, it is possible to detect the presence of SP responses and to measure its extent. Bockenholt and van der Heijden (2007) use a multivariate approach to estimate SP by proposing item randomized response model (Eq. 3), wherea common latent sensitivity scale is assumed for a set of RR variables, and the response behavior that does not follow the RR design is approached by introducing mixture components in the IRR models with a first component consisting of respondents who answer truthfully and follow an item response model, and a second component consisting of respondents who systematically say “no” to every item in a subset of items. A similar approach is adopted by Cruyff et al. (2007) who worked out the same idea in the context of log-linear models.
The paper of Bockenholt and van der Heijden (2007) also provides insight into characteristics of respondents who have higher probabilities to use SP. Two important variables are the perceived clarity of the instructions (respondents who found the instructions to be clear are more likely to state the truth) and education (respondents with a higher education are also more likely to state the truth). It is important to try out the instruction in a pilot study, possibly using a cognitive survey lab, to see how the RR questions are perceived (see Lensvelt-Mulders and Boeije 2007). Lensvelt et al. (2006) present a best practice that may be used as a starting point.
Bibliography:
- Agresti A (2002) Categorical data analysis. Wiley, New Jersey
- Bockenholt U, van der Heijden PGM (2004) Measuring noncompliance in benefit regulations with randomized response methods for multiple items. In: Biggeri A, Dreassi E, Lagazio C, Marchi M (eds) 19th international workshop on statistical modelling, Florence, Italy, pp 106–110
- Bockenholt U, van der Heijden PGM (2007) Item randomized-response models for measuring noncompliance: risk-return perceptions, social influences, and self-protective responses. Psychometrika 72:245–262
- Boruch RF (1971) Assuring confidentiality of responses in social research: a note on strategies. Am Sociol 6:308–311
- Chaudhuri A (2011) Randomized response and indirect questioning techniques in surveys. CRC Press, Boca Raton
- Chaudhuri A, Mukerjee R (1988) Randomized response: theory and techniques. Marcel Dekker, New York
- Clark SJ, Desharnais RA (1998) Honest answers to embarrassing questions: detecting cheating in the randomized response model. Psychol Methods 3:160–168
- Cruyff MJLF, van den Hout A, van der Heijden PGM, Bo¨ ckenholt U (2007) Log-linear randomizedresponse models taking self-protective response behavior into account. Socio Meth Res 36: 266–282
- Cruyff MJLF, van den Hout A, van der Heijden PGM, Bockenholt U (2008) The analysis of randomized-response sum score variables. J R Stat Soc Ser B 71:21–30
- Edgell SE, Himmelfarb S, Duncan KL (1982) Validity of forced response in a randomized response model. Socio Meth Res 11:89–110
- Elffers H, van der Heijden P, Hezemans M (2003) Explaining regulatory noncompliance: a survey study of rule transgression for two Dutch instrumental laws, applying the randomized response method. J Quant Criminol 19:409–439
- Fox J-P (2005) Randomized item response theory models. J Educ Behav Stat 30:1–24
- Fox JA, Tracy PE (1986) Randomized response: a method for sensitive surveys. Sage, London
- Kuk AYC (1990) Asking sensitive questions indirectly. Biometrika 77:436–438
- Lensvelt-Mulders GJLM, Boeije HR (2007) Evaluating compliance with a computer assisted randomized response technique: a qualitative study into the origins of lying and cheating. Comput Hum Behav 23:591–608
- Lensvelt-Mulders GJLM, Hox JJ, van der Heijden PGM, Maas CJM (2005) Meta-analysis of randomized response research: thirty-five years of validation. Socio Meth Res 33:319–348
- Lensvelt-Mulders GJLM, van der Heijden PGM, Laudy O, van Gils G (2006) A validation of a computer-assisted randomized response survey to estimate the prevalence of fraud in social security. J R Stat Soc A 169:305–318
- Maddala GS (1983) Limited dependent and qualitative variables in econometrics. Cambridge University Press, Cambridge
- Rasch G (1980) Probabilistic models for some intelligence and attainment tests. University of Chicago Press, Chicago, Originally published 1960, Copenhagen: The Danish Institute of Educational Research
- Scheers NJ, Dayton CM (1988) Covariate randomized response models. J Am Stat Assoc 83:969–974
- Van den Hout A, Kooiman P (2007) Estimating the linear regression model with categorical covariates subject to randomized response. Comput Stat Data Anal 50:3311–3323
- Van den Hout A, van der Heijden PGM (2002) Randomized response, statistical disclosure control and misclassification: a review. Int Stat Rev 70: 269–288
- Van der Heijden PGM, van Gils G, Bouts J, Hox JJ (2000) A comparison of randomized response, computer-assisted self-interview, and face-to-face direct questioning eliciting sensitive information in the context of welfare and unemployment benefit. Socio Meth Res 28:505–537
- Warner SL (1965) Randomized response: a survey technique for eliminating evasive answer bias. J Am Stat Assoc 60:63–69
See also:
Free research papers are not written to satisfy your specific instructions. You can use our professional writing services to buy a custom research paper on any topic and get your high quality paper at affordable price.
ORDER HIGH QUALITY CUSTOM PAPER

Always on-time

Plagiarism-Free

100% Confidentiality
