
This sample School Crime Statistics Research Paper is published for educational and informational purposes only. If you need help writing your assignment, please use our research paper writing service and buy a paper on any topic at affordable price. Also check our tips on how to write a research paper, see the lists of criminal justice research paper topics, and browse research paper examples.
By rights, schools should be sanctuaries against criminal victimization, but the truth is otherwise. A threatening environment is not conducive to academic success. The US federal law implementing No Child Left Behind (NCLB, the most recent national education-reform initiative in the USA) stipulates that school systems must have programs in place to reduce levels of violence. The legislation authorizing NCLB has a specific provision that “persistently dangerous” schools be identified by the states and that students attending such schools be given the option of transferring to another school. In practice, only a few dozen schools nationwide have been identified as persistently dangerous, but that fact reflects politics more than the empirical reality.
As it turns out, obtaining reliable information about crime in schools is a challenge – for researchers as well as for state and federal officials. There are several sources of data in addition to the schools’ own reports, but each source is error prone. There are some rather remarkable differences among them with respect to estimated crime rates and patterns.
Based on our review of the evidence, we offer several lessons about crime in school and about the sources of statistics on crime. First, with respect to sources, we find that crime surveys with adolescent respondents give results that are remarkably sensitive to the survey method. For example, in-school victimization rates from the Youth Behavior Risk Surveillance System (YRBSS) are more than 20 times as high as comparable victimization rates estimated from the National Crime Victimization Survey (NCVS), and they produce qualitatively different patterns over time. It is always a good idea to validate estimates from one source against others, but that may be especially true with youth surveys. On the other hand, we find administrative data to be better than expected.
We are able to reach some conclusions about crime patterns that we feel are sufficiently robust to be believable. Among our conclusions are these:
- Victimization rates for 12–18-year-olds are as high in school as out (and higher for the 12–14-year-olds), despite the fact that youths spend many fewer waking hours in school.
- Victimization patterns are quite different in and out of school. Violent crimes tend to be less serious in school (where only 1% of homicide victimizations occur).
- Property crime victimization rates are remark-ably homogeneous across race and also sex; alternative data sources are not consistent with respect to racial patterns of school violence.
- “Persistently dangerous schools” appear to be a real phenomenon and far more prevalent than are officially identified as such.
We begin this research paper with a discussion of the important data sources and then go on to discuss victimization patterns for students. We then explore the issue of persistently dangerous schools using a unique data set. We conclude with an analysis of arrest patterns.
Data Sources
The primary source of the US crime data for many purposes is the FBI’s Uniform Crime Reports, compiled from crimes known to the police and reported by police departments. The UCR’s crime data do not provide information on the characteristics of victims and are of little help in estimating crime rates in schools. Some jurisdictions report crimes in much more detail through the National Incident-Based Reporting System (NIBRS): in this system police agencies submit a record of each known crime that includes the age, sex, and race of the victim, the location of the crime, and the characteristics of the perpetrator (when known). These data can be used to provide a detailed description of crimes involving school-aged youths, distinguishing, for example, between crimes on school grounds and elsewhere (Jacob and Lefgren 2003). There are two problems, however, with this source. First, participation rates are very low: only 20 % of police agencies, representing 16 % of the US population, were participating in NIBRS as of 2003 (http://www.ojp.usdoj.gov/bjs/nibrsstatus. htm, accessed November 19, 2008). And second, crimes committed on school property may be less likely to become known to the police than crimes occurring elsewhere.
As a result of the limitations of police data, school crime statistics are usually generated from school reports or surveys. In the School Survey on Crime and Safety (SSoCS), a sample of about 3,000 public-school principals report to the US Department of Education the number of violent incidents and thefts and indicate how many of these incidents were reported to the police. In addition there are several recurrent sample surveys: the National Crime Victimization Survey and the biannual School Crime Supplement to this Survey (sponsored by the National Center for Education Statistics, or NCES) and the Youth Risk Behavior Surveillance System (YRBSS), sponsored by the Centers for Disease Control and Prevention (CDC). The NCES compiles data from all these sources into a report called the Indicators of School Crime and Safety (e.g., Dinkes et al. 2007). When the estimates from these alternative sources are compared, there emerge some rather dramatic differences, leaving the investigator with the challenge of deciding where the truth lies.
Youthful Victimization In School And Out
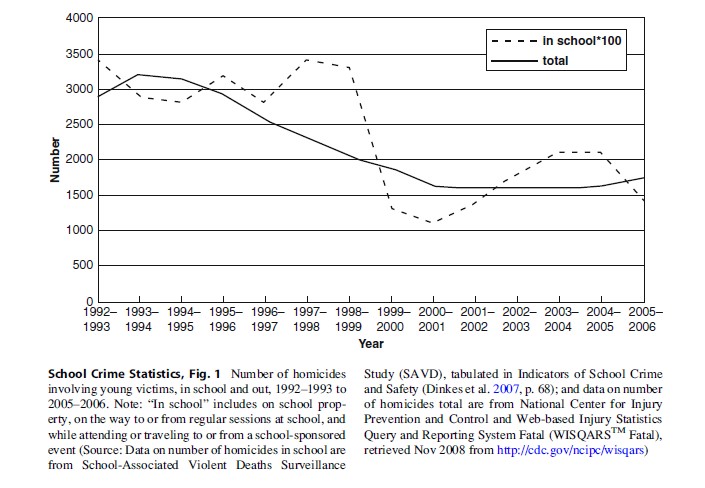
Here we report crime victimization rates for school-aged youths, comparing, when possible, the rates at school and at other locations. We begin with murder, which is the only crime for which the statistics are reasonably accurate. Figure 1 depicts the trend in murders on school property for youths ages 5–18, compared with the overall murder count for that age group. There were about 30 school murders of youths each year from 1992–1993 to 1998–1999, a period notorious for the series of school rampage shootings that culminated with Columbine High School on April 20, 1999. During that event 12 students and a teacher were murdered and 23 students injured, before the shooters committed suicide. In the year following Columbine, the national in-school murder count dropped sharply and has remained relatively low since then. The overall murder rate for the same age group follows a similar pattern, though the decline began earlier and is less abrupt. The most important lesson from these data is that only about 1 in 100 murders of this age group occurs in school. That was true during the peak years of the early 1990s and also true a decade later. By this measure, then, school appears much safer than other locations for school-aged youths.
However, schools have a much larger share of the nonfatal crimes with school-aged victims. Figure 2 depicts the trend for victimization rates of youths aged 12–18, including both theft and violence. Youths who have completed 12 years of school are excluded from this tabulation. The rates per 1,000 follow the trend for youth homicide (as well as the national trend for criminal victimization for all age groups) – a sustained and rather dramatic reduction, so that the 2005 figures are about one-third of the peak in 1993. For our immediate purpose here, the important thing to notice is that the victimization rate in school is about the same as out of school. That parity is the net result of theft, which has higher rates at school, and violence, which for most of the period has lower rates at school (although in-school and out-of-school rates of violence converged in 2004). Note that since youths spend over 80 % of their waking hours during a calendar year out of school (Gottfredson 2001, p. 21), the parity in victimization rates implies that youths are far more likely to be victimized during an hour in school than an hour elsewhere.
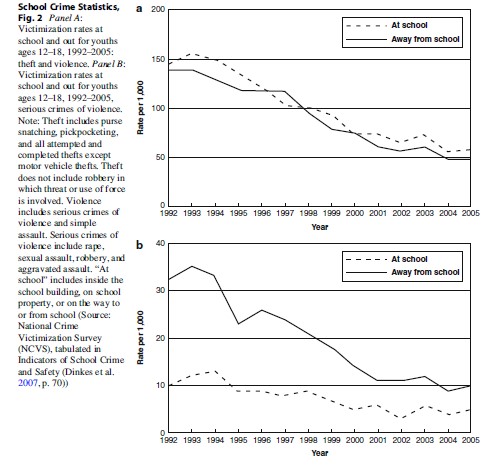
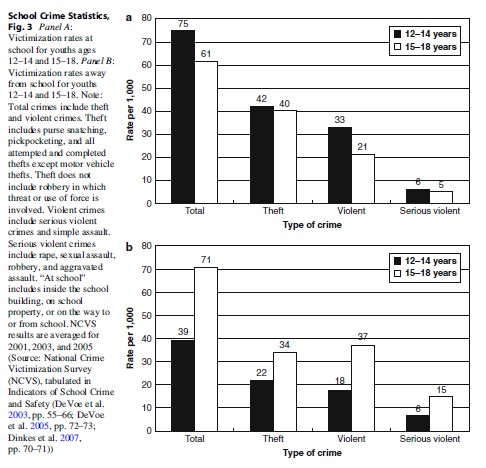
For the serious violent crimes of rape, robbery, and aggravated assault, NCVS victimization rates are twice as high away from school as at school during recent years, as shown in Panel B. Since the corresponding ratio for murder is 100 to1, we conclude that serious violent crimes committed out of school are far more likely to become murders than is true for similar crimes in school.
These NCVS results may well be misleading and should be validated. Youth survey data on crime are notoriously unreliable. In particular, crime survey results are exquisitely sensitive to the details of how the data are collected. One survey that provides an alternative to NCVS for estimating victimization rates is the Youth Risk Behavior Surveillance System (YRBSS), sponsored by the CDC. This survey yields estimates of victimization rates for serious violent crime that are an order-of-magnitude higher than the NCVS rates. For example, in the 2005 YRBSS, 8 % of students in grades 9–12 reported being threatened or injured with a weapon on school property during the previous 12 months. That compares with the serious-violence victimization rate at school for 15–18-year-olds in the NCVS of 0.4 %. Thus, the YRBSS rate is 20 times as high, even though logic suggests that it should be less, given that the YRBSS refers to prevalence of victimization and the NCVS figure is overall incidence (so that multiple victimizations reported by the same respondent are included in computing the rate). Further, the NCVS category of “serious violence” encompasses more types of crime than the YRBSS category of “threatened or injured with a weapon.”
What could account for this vast difference in results? First, the NCVS sample is interviewed every 6 months, and the previous interview serves as a bracket to help the respondent place events in time. Thus, the NCVS sample members are asked to report on events that occurred since the previous interview. The YRBSS, on the other hand, is a one-shot survey with no natural bracket on the time interval; respondents are asked to report on the previous 12 months, which creates the likelihood that some will report on serious events that occurred outside the designated period (a phenomenon known as “telescoping”). A second important difference is that all YRBSS respondents are asked the specific question about whether they were threatened or injured with a weapon on school property, whereas the only NCVS respondents who are asked about such an incident are those who first respond affirmatively to a more general screener question. Third, the NCVS questionnaire is administered to the respondent (in person or over the telephone) at home, whereas the YRBSS questionnaire is self-administered by the respondent while in school. These and other differences, none of which are relevant in a literal sense, appear to be hugely important to the respondents’ answers in practice. Cook (1987) notes that the Safe Schools study (which had much in common with the YRBSS with respect to administration) estimated one million robberies in schools, compared with the estimate of 30,000 in the NCVS for the same period.
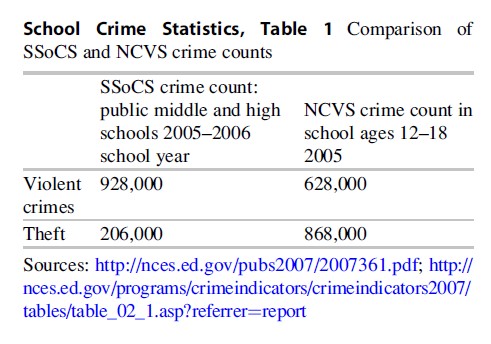
Given the disparate results from youth surveys, it is of interest to consider administrative data. The SSoCS gathers reports from public-school principals about crimes occurring during school hours. For the 2005–2006 school year, principals for middle and high schools reported a total of 928,000 violent crimes and 206,000 thefts (see Table 1). These counts are not precisely comparable to the NCVS results for 12–18-year-olds. Unlike the NCVS, the SSoCS is limited to public schools. The NCVS age range of 12–18 is roughly but not exactly comparable to the SSoCS category of “middle and high school.” Nevertheless, the estimates should be close. In fact, the violence reports are higher (by half) in the SSoCS than in the NCVS for 12–18-yearolds, while the SSoCS theft reports are much lower. It is not surprising that school officials do not know about many of the thefts that occur on school property, but the fact that they are aware of more violence that shows up in the NCVS defies ready explanation.
Thus, the truth about crime in school – or even a rough approximation of the truth – is elusive. Our inclination is to believe that the SSoCS reports provide a reliable lower bound for the “true” volume of crime, understating the true total to the extent that officials are never made aware of some crimes, and may generally be inclined to underreport in order to make their schools look as safe as possible. If true, then the NCVS appears to provide a notable underestimate of the volume of violence in schools – but the difference is nothing like that suggested by the very high YRBSS results. We are inclined to believe that the NCVS data are superior to the YRBSS because the method of administration discourages exaggeration by respondents, and the bracketing provides some discipline on memory. We also note that the downward trend in NCVS rates (shown in Fig. 2) reproduces well-documented trends during that period for the entire US population and hence is credible. The YRBSS victimization rates, on the other hand, exhibit no such trend during this period, showing if anything an upward tilt since 1993. For those reasons we report additional NCVS results in what follows, even though we are willing to believe that these are also far off the mark.
Table 2 summarizes demographic patterns in victimization rates at school for youths aged 12–18. Note that these data exclude the responses of students who have already completed 12 years of schooling. They do not exclude school dropouts. The rates shown here are averaged over the three most recent years of the School Supplement of the NCVS. Note that “theft” and “violence” sum to the total – “serious violence” is included in “violence.”
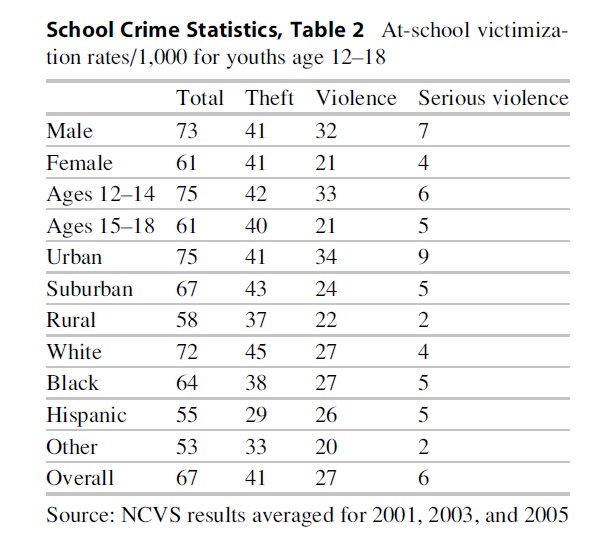
Theft rates are remarkably uniform across all demographic categories, averaging 41/1,000. Violence rates are a bit lower overall and more textured, although the differences among groups are still not as large as one might expect. Males are half again as likely to be victims of violence as females, and youths 12–14 are half again as likely as older youths. Urban schools experience a higher per capita rate of violent incidents than suburban or rural schools. Most surprising is that whites, blacks, and Hispanics report virtually the same rates of violence and serious violence.
The same NCVS data provide estimates for victimization rates away from school. The patterns are not much different, with two exceptions. First, blacks report a higher rate of serious violent crimes (17/1,000) than whites and Hispanics (both at 10/1,000). Second, and perhaps most intriguing, is that the age pattern away from school is the reverse of the age pattern at school. The younger group, aged 12–14, has somewhat higher victimization rates at school than the older group, but the older group has much higher victimization rates than the younger group away from school. The results are depicted in Fig. 3. The explanation may in part be due to the fact that the older group includes a number of school dropouts who, since they are not attending school, are unlikely to be victimized on school property. Perhaps more important is that older youths have greater mobility and freedom outside of school and thus more opportunity to get into trouble.

In assessing the credibility of these results, we are inclined to believe the NCVS-based comparisons between in-school and out-of-school victimizations, since it is the same respondents and hence the same biases are likely to apply. The surprising homogeneity of theft and violence victimization between blacks, whites, and Hispanics can be checked against interschool patterns in the SSoCS. We do that below and find support for the theft results but an apparent contradiction with the results on violence.
Finally, we note the high prevalence of bullying in school. While not necessarily a crime, bullying can greatly color the school experience for some children. The NCVS School Crime Supplement found that in 2005, 28 % of youths ages 12–18 reported being bullied in school – of those, 79 % said they were bullied inside school, 28 % outside on school grounds, and 8 % on the school bus (Dinkes et al. 2007, p. 95).
Differences Among Schools
Up until this point, we have described crime patterns primarily with respect to the characteristics of the victims. From another perspective, school crime is a characteristic of the school, and there is strong evidence that school characteristics and policies influence crime victimization rates (Cook et al. 2010).
The 2005–2006 SSoCS classifies schools by grade level, enrollment size, urbanicity, and percent minority enrollment. The rate of violent incidents reported by principals is much higher for middle schools than either elementary or high schools, somewhat higher for city schools than those in suburban or rural communities, and higher in predominantly minority schools than those with less than half minority. Notably, there is little relationship between the size of the school and the violence victimization rate. The results for theft tend to be less patterned. Table 3 summarizes the results.
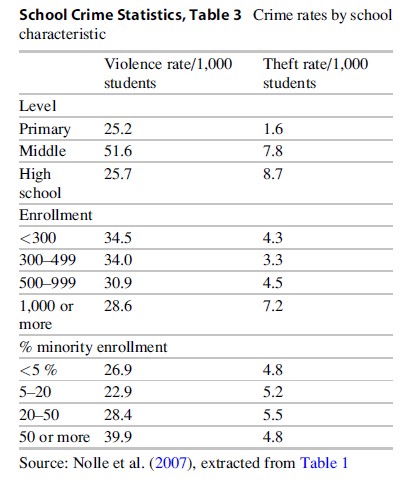
In one respect these patterns are at odds with NCVS victimization patterns. It appears that the relatively high rate of violence in minority schools is at odds with the NCVS finding that there is little difference in victimization rates by race. One possibility is that black respondents are less likely to report violent victimizations than white respondents in the NCVS or alternatively (as reported in Kinsler 2009) that school administrators in predominantly black schools are relatively likely to record violent crimes. The same source, SSoCS, reports information on gang-related crime. In 2005–2006, 11 % of middle schools and 16 % of high schools reported at least one crime that was gang related. Gang-related crimes were concentrated in large, urban, and predominantly minority schools (Nolle et al. 2007, Table 4). Some confirmation for these patterns comes from the NCVS School Supplement data. Students were asked about gangs in their schools. Affirmative responses were much more likely by black and Hispanic students and by students in urban areas.
Another way to illustrate the variability across schools in crime levels is by comparing the distribution of the number of crimes reported per school with a distribution that would be generated under a random process. This type of exercise is common in criminological research. In a study of more than 23,000 boys born in two birth cohorts in Philadelphia, Tracy et al. (1990), for example, discovered that a small fraction of the boys (5–6 %) committed a majority of the delinquent acts. Similarly, researchers who study neighborhood crime have observed that it, too, is clustered at certain addresses. Weisburd et al. (2004), studying street segments in Seattle over a 14-year period, found that 4–5 % of the street segments account for about 50 % of incidents in each of the years examined. The distribution of crime at the school level is also concentrated, although not to the same degree.
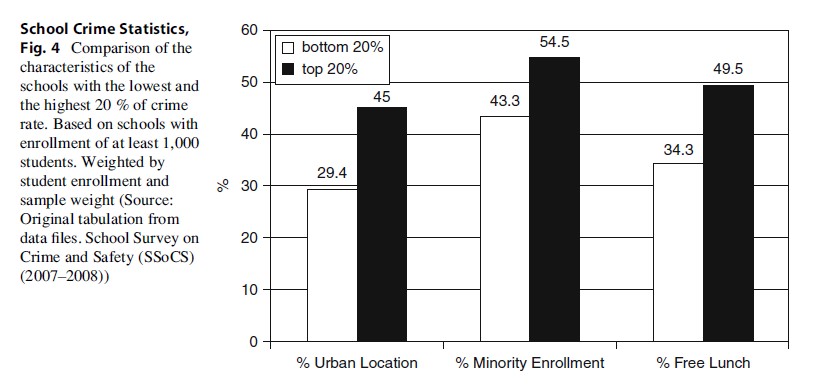
We examined the distribution of school crime in the 2007–2008 SSoCS data using schools with enrollments of at least 1,000 students (N = 8,843), because we assumed rank orders based on crime rates would be unstable for small schools. These analyses used sample weights provided by NCES and also weighted by student enrollment. In these data, the 22.5 % of large schools with the highest per capita crime rates account for 50 % of all crimes reported by principals. The top 20 % of schools experience much higher crime rates than does the bottom 20 %: the victimization rates per 1,000 students for students in the most and least safe 20 % of schools are 9.8 and 111.3 for all crimes. The difference is even more striking for rates of violent crime – more than 13 times higher in the top 20 % of schools (4.9 vs. 65.7 per 1,000). These results suggest that although the average school is indeed a relatively safe place, a minority are notoriously unsafe. Figure 4 contrasts the safest 20 % of schools with the most dangerous 20 %. The more dangerous schools are much more likely to be urban schools, schools serving a high percentage of minority students, and schools serving more disadvantaged student populations.
The NCLB Act requires states to establish a mechanism for identifying such unsafe schools. Once a school has been labeled through this process as “persistently dangerous,” parents must be given the option of transferring their child to a safer school. Every state has responded to this requirement by defining “persistently dangerous” and establishing a procedure for identifying such schools. The definitions differ considerably from state to state according to the specific offenses considered to be indicators of dangerousness; whether or not an official response (e.g., expulsion, arrest, conviction) to the incident is required before it is considered a dangerous offense and whether or not a dangerous offense occurring in or around the school has to have been committed by a student; the cut-point for the number or rate of offenses above which a school is to be considered dangerous; and the number of years in the dangerous status required to be considered “persistently” dangerous. Also, some states use a multistage process for identifying unsafe schools. For example, Florida’s policy calls for a first stage in which a school is considered potentially dangerous if, for 3 consecutive years, it (a) has a federal Gun-Free School Act violation and (b) expels 1 % or more of a student body that is greater than 500 students, or 5 students if the student body is 500 students or less, for homicide, battery, sexual battery, or weapons possession-related offenses. Any school so identified must, in a second stage, conduct an anonymous school-wide survey of students, parents, and school personnel. Only schools in which 51 % or more of survey respondents judge the school to be unsafe are labeled persistently dangerous (Education Commission of the States 2004).
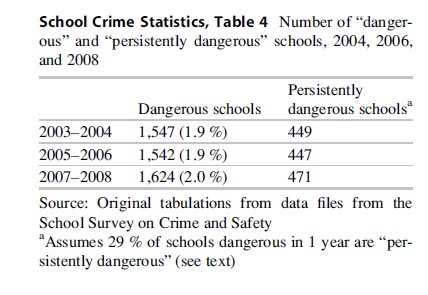
Beginning with the 2003–2004 school year, the number of persistently dangerous schools reported by all states combined to the US Department of Education has ranged from 36 to 49, averaging 44. That low count raises the question of just how effective is the NCLB legislation for encouraging states to identify unsafe schools. We used the SSoCS survey data to identify schools that might reasonably be considered persistently dangerous. As noted above, there is no standard definition to guide this effort. Almost all states, however, include incidents involving serious violent behavior and weapons-related offenses, and many states also include incidents involving illegal drug use, possession, and distribution. Almost all states require that the rate of incidents per 100 enrolled students be between 1 and 3 before a school will be considered dangerous. Most states require that schools remain in this status for 3 years, but some require only two. We therefore classified schools in the SSoCS sample as dangerous during the 2007–2008 school year if, according to their principals’ reports, the number of serious violent offenses (e.g., rape, sexual battery other than rape, physical attack or fight with a weapon, threat of physical attack with a weapon, and robbery with or without a weapon) plus the number of weapons-related incidents (those involving firearms, explosive devises, knifes, or sharp objects) exceeded 2 per 100 enrolled students. We repeated this analysis adding the number of incidents involving illegal drugs (distribution, use, or possession) to the classification of dangerous. Doing so increases the number of schools identified as dangerous. Our conclusion about the under-identification of unsafe schools using the NCLB procedure would therefore be stronger if these drug offenses were included.
Although the SSoCS survey is cross-sectional by design, it is administered to a random sample of US school every 2 years. The sample design is stratified and over-samples middle and high schools. Some schools happen to be included in multiple years just by chance. By merging the 2007–2008 survey data with data from the two prior SSoCS surveys (2003–2004 and 2005–2006), we created a longitudinal sample containing 475 schools. This longitudinal sample over-represents secondary schools, large schools, and schools in areas that are not located in rural areas but is nevertheless helpful for examining the extent to which dangerousness persists across time.
Table 4 shows that applying our definition of dangerousness to the entire sample of schools in each of the 3 years resulted in identifying between 1.9 % and 2.0 % of the nation’s schools in each survey year. The associated point estimates for the numbers of dangerous schools identified were 1,547 (2003–2004), 1,542 (2005–2006), and 1,624 (2007–2008). Using the longitudinal sample, we determined that 29 % of schools identified as dangerous in 1 year were also identified as such 2 years earlier. This exercise suggests that between 447 and 471 schools might be considered persistently dangerous in any given year. That estimate is about ten times as high as the average number of persistently dangerous schools identified to the US Department of Education each year, just 44.
Concluding Thoughts
There are a variety of sources of statistics on crime in schools, which are not entirely consistent with respect to levels, patterns, and trends. Anyone wishing to make sense of the available statistics should first become informed on the details of how the data are generated and consider the likely biases and as much as possible compare different sources.
We believe that the homicide statistics are accurate but that other police data on school crime are not to be trusted. For nonfatal crimes, we place some credence in the NCVS for students, which is a recurrent survey implemented by the US Census Bureau. What one learns from this source is that crime victimization in schools for students followed the downward trend in national crime rates during the 1990s and remains at a relatively low level since 2000. That there would be a common trend that makes sense and is one illustration of a more general result that crime in schools is closely linked to crime in the community.
Another credible result is that there is a great deal of crime in schools perpetrated by and against students. However, the estimated rates and patterns differ widely among the various sources in common use. According to the NCVS, in-school victimization rates are similar to rates experienced outside of school. But we found order-of-magnitude differences in school crime rates from NCVS and YRBSS, CDC’s recurrent youth survey in which youths self-report their own victimizations. The SSoCS, based on reports from school principals, also produces counts of violent crimes that are 50 % higher than the NCVS counts. We would nominate SSoCS as the most reliable source for violent crime, but there is no basis for comparison with out-of-school crimes. We can be confident that homicide is very rare in school (relatively and absolutely). All sources confirm that a much higher percentage of minor assaults occur in schools than serious assaults. It also seems reasonable to conclude that school crime is far from randomly distributed across schools. A relatively small number of schools experience inordinately high rates of theft and violence. Rates of crime in the least safe 20 % of schools are more than ten times higher than the rates of crime in the safest 20 %. Students in these schools are likely to avoid school for fear of their own safety, teacher turnover is likely to be high, and the quality of time dedicated to learning is likely to be diminished. Unfortunately, no reliable mechanism has been established to identify which of these schools should be identified as “persistently dangerous.” The consequences for being labeled “persistently dangerous” under NCLB are sufficiently punitive to create a strong incentive for principals to underreport and for state boards of education to establish policies that minimize application of that label.
What should be done to advance knowledge about school crime and to provide a reliable mechanism for identifying schools requiring assistance? The place to begin the research agenda on crime in schools is with a close look at the quality of the data in current use. Despite the many problems we identified earlier, it is too often true that users do not investigate the quality of the data or check one source against another. It would be a useful service to all users if there were a comprehensive investigation of the differences in crime rates and patterns across these data sets, together with an investigation of the sources of disagreement. One thing that is clear is that survey results with adolescent subjects are exquisitely sensitive to where and how the questions are administered.
Beyond acquiring a better understanding of the sources of discrepancy across different methods for obtaining school crime data, a serious effort is needed to develop shared understandings of what constitutes a dangerous school. Rather than asking each state to develop its own idiosyncratic definition and identification procedure, we suggest that a higher level dialogue is needed to understand the cut-point above which the school environment is truly-dangerous to students and staff or seriously hinders learning. A discussion about how school safety might be monitored more systematically is needed. We suggest that rather than counting the number of certain incidents or responses to certain offenses, which are likely to be extremely rare and confounded with characteristics of school’s surveillance and reporting practices, a more direct measure of school safety might come from student and staff surveys of perceptions of safety and the extent to which they avoid the school or certain areas in the school for fear of their own safety. Such survey measures have been a staple of school climate research since the 1970s and have proven to be highly reliable and stable measures of the school environment. At least one state (Florida) already uses such a strategy to identify persistently dangerous schools.
We also suggest that once a reliable mechanism is in place for identifying schools with problematic crime levels, efforts should be directed towards making the schools safer. Rigorous research (Gottfredson et al. 2002; Hahn et al. 2007; Wilson and Lipsey 2007) has identified a variety of school-based prevention and intervention practices that are likely to reduce the level of crime experienced in these schools.
References
- Centers for Disease Control and Prevention (2008) Youth Risk Behavior Surveillance – United States, 2007 MMWR
- Cook PJ (1987) Robbery violence. J Crim Law Criminology 70:357–376
- Cook PJ, Gottfredson DC, Na C (2010) School crime control and prevention. In: Michael T (ed) Crime and justice: a review of research, vol. 39. University of Chicago Press, Chicago, Available at http://papers. ssrn.com/sol3/papers.cfm?abstract_id¼1368292
- DeVoe JF, Peter K, Kaufman P, Ruddy SA, Miller AK, Planty M, Snyder TD, Rand MR (2003) Indicators of school crime and safety: 2003. US Dept. of Justice, Office of Justice Programs, Bureau of Justice Statistics NCJ 210257.
- DeVoe JF, Peter K, Noonan M, Snyder TD, Baum K (2005) Indicators of school crime and safety: 2005. US Dept. of Justice, Office of Justice Programs, Bureau of Justice Statistics NCJ 210697.
- Dinkes R, Cataldi EF, Lin-Kelly W (2007) Indicators of school crime and safety (NCES 2008-021/NCJ 219553). National Center for Education Statistics, Institute of Education Sciences, U.S. Department of Education, and Bureau of Justice Statistics, Office of Justice Programs, U.S. Department of Justice, Washington, DC
- Education Commission of the States (2004) Persistently dangerous school criteria, Updated September 2004 http://www.ecs.org/clearinghouse/52/98/5298.pdf (downloaded 25 Sept. 2009)
- Gottfredson DC (2001) Schools and delinquency. Cambridge University Press, New York
- Gottfredson DC, Wilson DB, Najaka SS (2002) Schoolbased crime prevention. In: Sherman LW, Farrington DP, Brandon WC, MacKenzie DL (eds) Evidencebased crime prevention. Routledge, London
- Guerino P, Hurwitz MD, Noonan ME, Kaffenberger SM (2006) Crime, violence, discipline, and safety in U.S. Public schools: findings from the school survey on crime and safety: 2003–04 (NCES 2007-302rev). U.S. Department of Education, National Center for Education Statistics, Washington, DC
- Hahn RA, Fuqua-Whitley DS, Lowy J et al (2007) A review of the effectiveness of universal school-based programs for the prevention of violence. Am J Prev Med 33:S114–S129
- Hernandez N (2007) No child’ data on violence skewed: each state defines ‘dangerous school’ (November 18, p. A01). Washington Post. 77, 67–74
- Jacob BA, Lefgren L (2003) Are idle hands the devil’s workshop? Incapacitation, concentration, and juvenile crime. Am Econ Rev 93:1560–1577
- Jekielek S, Brown B, Marin P, Lippman L (2007) Public school practices for violence prevention and reduction: 2003–04 (NCES-2007-010). U.S. Department of Education, National Center for Education Statistics, Washington, DC
- Kinsler J (2009) School discipline: a source or salve for the racial achievement gap? Unpublished manuscript, University of Rochester, New York
- Nolle KL, Guerino P, Dinkes R (2007) Crime, violence, discipline, and safety in US public schools: findings from the school survey on crime and safety: 2005-6 (NCES 2007-361). U.S. Department of Education, National Center for Education Statistics, Washington, DC
- Tracy PE, Wolfgang ME, Figlio RM (1990) Delinquency careers in two birth cohorts. Plenum Press, New York
- Weisburd D, Bushway S, Lum C, Yang SM (2004) Trajectories of crime at places: a longitudinal study of street segments in the city of Seattle. Criminology 42(2):283–321
- Whitaker C, Bastian LD (1991) Teenage victims: a national crime survey report (NCJ-128129). U.S. Department of Justice, Bureau of Justice Statistics, Washington, DC
- Wilson SJ, Lipsey MW (2007) School-based interventions for aggressive and disruptive behavior: update of a meta-analysis. Am J Prev Med 33:S130–S143
See also:
Free research papers are not written to satisfy your specific instructions. You can use our professional writing services to buy a custom research paper on any topic and get your high quality paper at affordable price.
ORDER HIGH QUALITY CUSTOM PAPER

Always on-time

Plagiarism-Free

100% Confidentiality
