
This sample Cost-Benefit Analysis Research Paper is published foreducational and informational purposes only. If you need help writing yourassignment, please use our research paper writing service and buy a paper on any topic ataffordable price. Also check our tips on how to write a research paper, see the lists of criminal justice research paper topics, and browse research paper examples.
TEXT
The use of economic analysis (EA) in crime and justice research has increased in recent years from the need to quantify the effectiveness and efficiency of interventions and policies. The New Welfare Economics model pursues an economic decision rule known as the Kaldor-Hicks criterion. This rule forms the underlying rationale for cost-benefit analysis (CBA). In short, CBA is used to evaluate options (e.g., interventions, programs, or policies) by comparing the total benefits with the total costs of the respective options. Results of EA assist in informing policy on the economic feasibility of the options in question. This research paper briefly summarizes the underlying conceptual foundations of CBA and why CBAs are important to policy decision-making from a societal perspective. To illustrate the use of CBA, this research paper provides two examples of CBAs conducted of third-party policing interventions highlighting potential limitations of the applied method.
Fundamentals
Importance Of Economic Analysis
Economic analysis (EA) is increasingly used as a regulatory and policy development tool to assist decision-making in the area of crime and justice. Since the 1980s, there has been a requirement that major regulatory initiatives (in the USA) incorporate cost-benefit studies to supplement the noneconomic evidence, for example, Executive Order 12291 promulgated by President Regan and, more recently, Executive Order 12866 issued by President Clinton. Factors including political ideology and limited fiscal and personnel resources inevitably affect policy decisions. However, the inclusion of EA provides salient information with respect to the economic impact of decisions on individuals and more broadly society (Boardman et al. 2006).
EAs provide decision-makers with information about the most economically efficient policies and programs by assessing comparative costs and benefits (Manning et al. 2011). Such information provides an economic rationale for the allocation of scarce public resources. Further, EAs promote economic efficiency and good fiscal management by assessing available options to ensure the greatest return on investment. EAs also allow policy makers to judge the economic implications of existing policies and/or programs.
Key Economic Concepts
Studies that observably lack the important economic concepts that form the foundation of economic analysis are problematic. These studies tend to be exercises in accounting rather than EAs. The important economic concepts include Pareto efficiency, potential Pareto efficiency, willingness to pay, and opportunity costs.
Pareto Efficiency
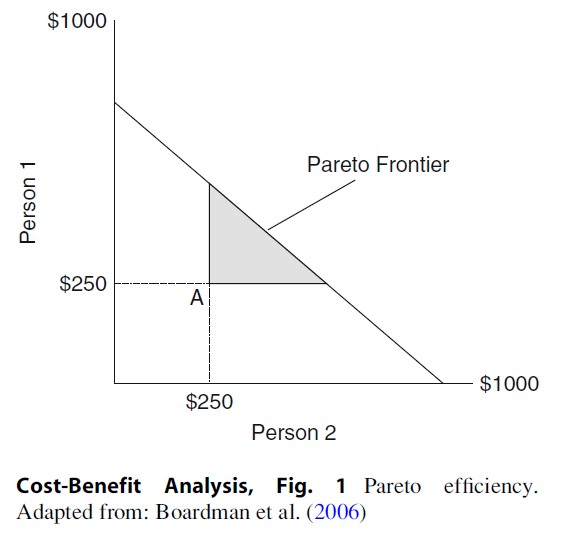
Boardman et al. (2006)explain that “.. .an allocation of goods is Pareto efficient if no alternativeallocation can make at least one person better off without making anyone else worseoff” (p. 26). That is, we achieve an efficient allocation of resources when oneperson is made better off, but not at the cost of another. Figure 1 illustratesthis concept by splitting a fixed amount of money between two people. Thevertical axis measures the amount ($) received by person 1, and the horizontalaxis the amount received by person 2. The sloping line represents the potentialPareto frontier. The frontier represents all feasible combinations ofallocations between the two people. If the two agree, each person receives thefull amount as indicted by the intersection on the x and y axes ($1,000 each).However, if they do not agree, then they receive only $250, which representsthe status quo (A). The shaded triangle represents Pareto improvements over thestatus quo. Therefore, the shaded triangle illustrates all the alternativeallocations that make at least one person better off (than the status quo)without making the other worse off. However, Pareto improvements are not Paretoefficient, as there is the possibility of further Pareto improvements. Onlywhen the potential Pareto frontier is reached is it not possible to makefurther reallocations (Manning 2008).
Kaldor-Hicks Criterion
Adopting the strict Pareto efficiency rule for CBA requires that policies are only adopted if they yield positive benefits and that full compensation or a set of transfers can be made that makes at least one person better off without making anyone else worse off. This requires analysts to value all impacts in terms of, for example, willingness to pay and value inputs with respect to opportunity costs. This ideal holds that there are only winners and no losers. As appealing as this is, difficulties arise given (1) the burden on analysts to measure aggregate costs and benefits inferred from observing prices and the quantification of market and nonmarket goods, (2) the unfeasibility of valuing all the costs and benefits to each person affected, (3) the difficulty in identifying the administrative costs of policy and the pragmatic and ethical limitations of identifying and allocating potential transfers or compensation models, and (4) the incentive for individuals to cheat by overstating the costs and understating the benefits they would receive from policies (Boardman et al. 2001; Mishan 1972). If this criterion were adopted, the result would be forgoing most policies with potential net benefits to society at large and too much effort placed on identifying transfers or compensation for losers.
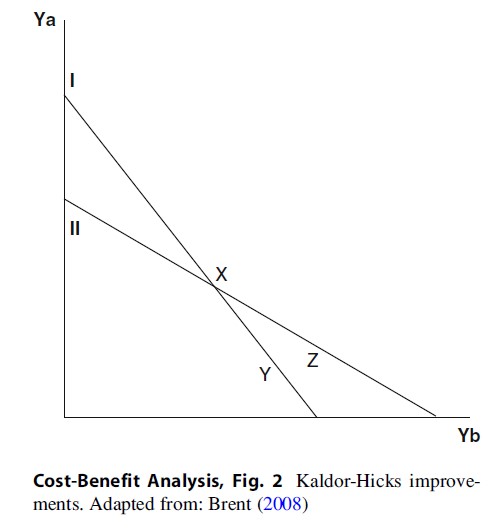
Consequently, the framework of the old economic doctrine (the neoclassical Cambridge School) gave way to New Welfare Economics model arguing that CBA utilize an alternative decision rule with possibly less conceptual appeal but more practicability. Known as the Kaldor-Hicks criterion, or the net benefits criterion, a policy is potentially Pareto efficient and should be adopted if there are positive net benefits. Moreover, as long as there are net benefits, then it is possible to compensate losers so that the policy could be Pareto improving. In short, the key difference between the Pareto efficiency and the Kaldor-Hicks criterion is with respect to compensation, so that transfers can be made to those who are worse off under the policy. Given this, every Pareto improvement is a Kaldor-Hicks improvement, but the majority of Kaldor-Hicks improvements are not Pareto improvements. Figure 2 provides an example of the Pareto improvement process. Budget line I is the income before the policy/intervention and budget line II is income after the policy/intervention. The figure demonstrates that the allocation for x and y are not comparable as there is more Ya at x and more Yb at y. However, if income is redistributed along II from x to z, there is more Ya and Yb at z than at y. Therefore, point z is a potential Pareto improvement (i.e., both could be made better off). In summary, under the Pareto improvement criterion, there must be positive net benefits to both participants and that no one is made worse off under the new policy.
Given the unlikelihood for a policy to make no one worse off, under the Kaldor-Hicks criterion, compensation can be made to gain net benefits. For example, person 1 receives a utility of ten I (arbitrary score) and person 2 a utility of 100. If the new or proposed policy changes the utility received from person 1 and 2 to 20 and 99, respectively, the change would not be Pareto efficient as person 2 is now worse off. However, a Kaldor-Hicks improvement is achieved as person 1 could theoretically compensate person 2 (between one and ten utils) to accept the situation. A full review of the Kaldor-Hicks criterion including a thorough critique of the compensation test and the distribution of income is available in Brent (2008).
The Kaldor-Hicks criterion forms the underlying rationale for CBA. For example, CBA is used to evaluate a project or policy by comparing the total costs of the program with the total benefits. Thus, if benefits exceed costs, then the program would normally go ahead. This is effectively an application of the Kaldor-Hicks criterion because it is equivalent to requiring that the benefits received by winners should be enough to compensate the losers. The Kaldor-Hicks criterion is used for decision-making because (1) policies with net social benefits maximize aggregate wealth; (2) a redistribution of a normal good indirectly helps those who are worse off in society because richer societies have a greater capacity for redistribution; moreover, ceteris paribus, if redistribution is a normal good and because people want more as their wealth increases, then their capacity and willingness to help may increase; (3) government activity will have different sets of winners and losers, but the costs and benefits of different policies may average out over the full set of government activity for each person; and (4) an equal distribution of wealth or income may be possible through direct transfers after a number of “efficiency-enhancing” policies are adopted—transfers can be done wholesale as opposed to retail (Boardman et al. 2001; Zerbe et al. 2006).
Willingness To Pay
Calculating the net benefits associated with a policy requires estimating inputs and outputs. Willingness to pay enables the modeling of how a person values the outputs associated with a policy. Through a series of questions, information about the payments required or potentially received by a person is elicited, so that they become indifferent between what is already occurring (status quo) and the policy in question (with payments). In short, willingness to pay identifies how much (i.e., dollar amount) a person is willing to give up to acquire a good or a service. For example, consider a policy that is relevant to three people. Person 1 says that they would be indifferent between the policy and status quo at $1,000. Person 2 says that they would be indifferent between the policy and the status quo at $2,000. However, person 3 does not like what the policy offers so they would have to receive a payment of $2,500 ( $2,500) to feel just as well off under the status quo. The sum of the willingness to pay values (persons 1, 2, and 3) is a measure of the net benefits of the impact of the proposed policy. In this example, benefits equal $3,000 and costs equal $2,500. Therefore, net benefits of the policy are positive (+$500). This scenario, however, is not Pareto efficient, as person 3 is made worse off with respect to the status quo. But this could be altered if person 1 was to give $750 and person 2 was to give $1,750 to person 3. This is now a Pareto efficient solution as persons 1 and 2 are better off than the status quo (+$250) and person 3 is no worse off. The point is that if aggregate net benefits of a policy are positive for all concerned, then solutions exist to make the policy a Pareto improvement over the status quo (Boardman et al. 2001).
Opportunity Costs
Objectives are achieved through the use of inputs. Economists use costs in CBA to value inputs, assess their efficient use, or to assess the required inputs to produce or implement a policy or program (Boardman et al. 2006). Costs are seen as opportunity costs. That is, if the input is not used in one context, it could be used in another (Manning et al. 2006). In other words, the opportunity cost of using an input is its value in its best alternative use. The best measure of the opportunity cost of a resource is its market value or price (Drummond et al. 1987).
Returning to the example of three persons whose willingness to pay for a given policy was $500, if the opportunity cost of inputs to produce the policy were $750, then some people would have to forgo $750 for goods valued at this price. In this scenario, the policy does not produce adequate benefits to the three people to allow them to compensate those who must forgo the $750 ($500 in net benefits to the three persons minus $750 in opportunity costs ¼ $250). In this scenario, the opportunity cost is too high and does not produce enough benefits to compensate all. However, if the opportunity cost was $200, then net benefits in society would be positive ($300) and make it possible to compensate all those who bear a cost so that no one is made worse off, and some people are made better off under the policy (Boardman et al. 2001).
Common Tools Used For Economic Analysis
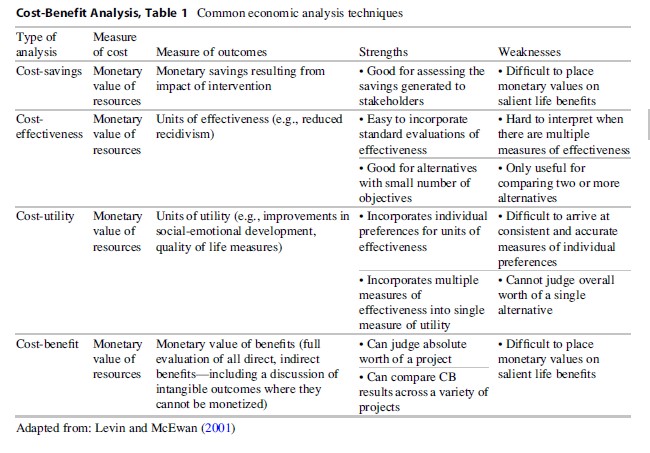
Four common methodsused to assess the economic efficiency/effectiveness of program alternativesare cost-savings, cost-effectiveness, cost-utility, and cost-benefit analysis.A number of less rigorous economic methods, which provide useful information topolicy makers, include cost analysis, cost-of-illness analysis, andcost-consequence analysis. The various economic tools address somewhatdifferent decision-making questions, require different data (depending on the questionand stakeholder), and represent different degrees of analytical sophistication(Manning et al. 2006). Table 1 provides a brief summary of cost-savings,cost-effectiveness, cost-utility, and cost-benefit analysis with respect to themeasurement of costs and outcomes and strengths and weaknesses of the variousapproaches. A full discussion of the four main methods is provided in Manning(2008).
Discounting Costs And Benefits
After assessing costsand benefits, both must be discounted to allow for potential timedifferentials. For example, since we perceive costs incurred in the present to beless of a burden than costs incurred in the future (Manning 2004), future costsmust be discounted to properly compare them with present costs. One calculatesalternative investment patterns by calculating their present value. The formulafor estimating the present value of future costs is presented in Eq.1:
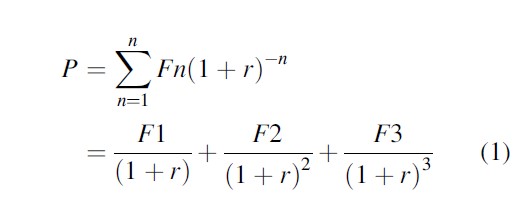
where P = present value, Fn = future costs at year n, and r = the discount rate. The choice of discount rate has always been controversial but three conceptual approaches are available: (1) returns to consumer savings options (cash rate) (Levin and McEwan 2001), (2) average returns to investment made by the private sector (Boardman et al. 1996), and (3) weighted average of methods 1 and 2 (Levin and McEwan 2001). A full discussion of these methods is provided in Manning (2008).
Net Present Value
When assessing the economic rationale of a program or policy, Manning et al. (2006) propose that evaluators measure the costs and potential benefits using net present value (NPV). NPV equals the difference between the present value of benefits relative to the present value of costs. In short, the NPV criterion is simple: adopt the program if the NPV is positive. Specifically, one would adopt a project if the NPV = present value (benefits) – present value (costs) > 0 (Boardman et al. 2006).
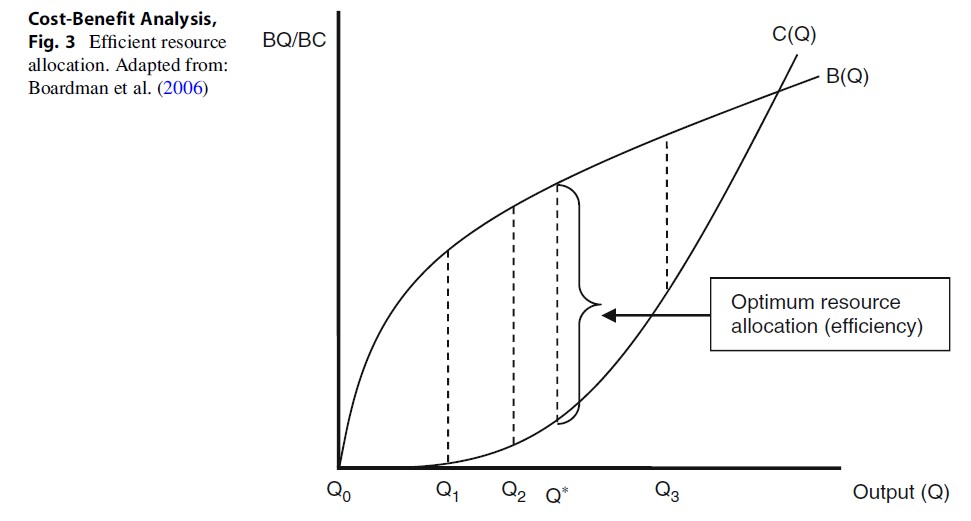
NPV has a caveat; NPVdoes not necessarily identify the most efficient allocation of resources.Rather, NPV identifies the more efficient allocation of resources. For example,an intervention for which program alternatives vary with respect to potentialoutput Q is considered in Fig. 3. The benefits and costs associated withalternatives are represented by the functions (BQ) and (BC), respectively.Moving from Q0 to Q* increases efficiency, but at a decreasing rate.That is, NPV(Q*) > NPV(Q2) > NPV(Q1) > NPV(Q0).However, as we move beyond the optimal scale (Q*), the net benefits decrease.Net benefits remain positive until the point where the curves C (Q) and B (Q)intersect. The problem is that Q* may not have been selected as it was notincluded in the set of evaluated options. Therefore, NPV identifies the moreefficient alternative among the group of alternatives evaluated but does notidentify the most efficient alternative. The optimum alternative (Q*) may havebeen omitted because of bounded rationality problems (i.e., cognitivelimitations of both knowledge and cognitive capacity) (Manning et al. 2011),the optimum level may not have been known, or budgetary or politicalconstraints may have limited the range of alternatives considered for evaluation.This considered, however, NPV is still an appropriate method as it providesaccurate answers with respect to the alternatives that are evaluated (Boardmanet al. 2006).
Incremental Cost-Comparison Analysis
Any economic analysis should include an incremental cost-comparison analysis of the available options. The term incremental cost analysis refers here to a change in the scale of activity; in other words, the difference in cost or effect between two or more options being compared.
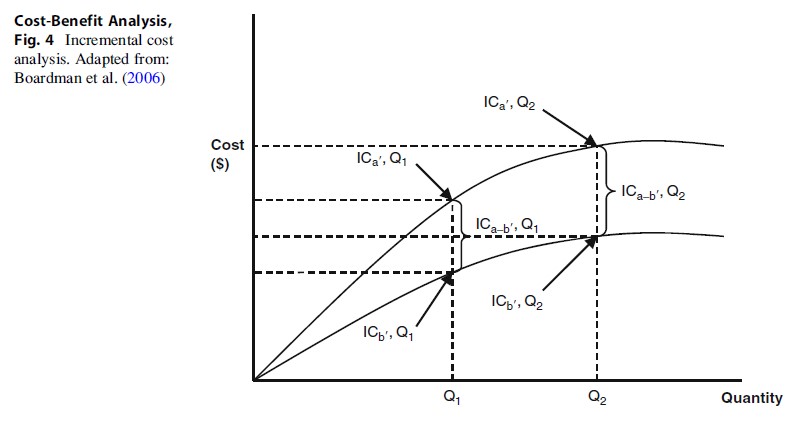
Figure 4 provides a diagrammatic representation of the incremental cost curve, where ICa’, Q1 is the cost of option 1 at quantity (activity level) Q1, and ICb’, Q1 is the equivalent estimate for option 2. The incremental difference (cost) between option 1 and option 2 at quantity (activity level) Q1 is ICa-b, Q1.

Figure 4 highlightsthat the incremental cost is equal to the change in total cost divided by the changein quantity. This may appear to be a marginal cost; however, the incrementalcost is distinguished from the marginal cost by holding Q constant at Q = 1 (Q1).Therefore, the alternatives (activities) are compared at Q = Q1.
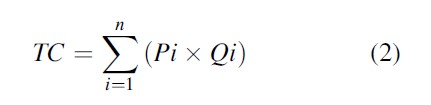
The incremental costis represented mathematically in Eq. 2:
where
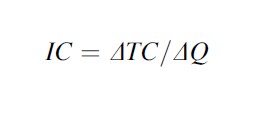
Note, IC = incremental cost, Q = quantity/activity, Δ = change in activity, TC = total cost, Pi = price of inputs (derived from Table 3’) and Qi = quantity of inputs.
The Optimal Choice Of An Action
The optimal choice of an action for a decision-maker is to maximize the benefits they receive less the opportunity cost. Comparing the addition to benefits with the addition to opportunity costs identifies the optimal choice. These are commonly referred to as the marginal benefit and the marginal cost of an action. The rule for optimal decision-making is that the program should be funded if the additional benefits from the program are equal to or greater than the additional costs. A full discussion of making the optimal decision and marginal CBA is available in Boardman et al. (2006).
Examples Of Cost-Benefit Analyses
Below, two economic analyses of two third party policing (TPP) interventions are discussed to illustrate the use of cost-benefit analysis and its potential limitations. For those not familiar with TPP, it is defined as
.. .police efforts to persuade or coerce other regulators or non-offending persons, such as health and building inspectors, housing agencies, property owners, parents, and business owners, to take some responsibility for preventing crime or reducing crime problems (Buerger and Mazerolle 1998, p. 301).
Ma˚nsdotter et al. (2007) conducted an economic evaluation of a multicomponent TPP alcohol prevention program implemented in licensed premises in Stockholm, Sweden. The study aimed to quantify the societal savings directly generated from the intervention. Savings were estimated as potential monetary consequences of victims of violence to the judicial system (e.g., police, public prosecutor, courts, prisons), production changes (e.g., sickness absence, other effects on working hours), health care (e.g., transport from crime scene, emergency treatment, inpatient care, outpatient care, pharmaceuticals), and other damage (e.g., technical support, personal assistance, and personal belongings). In addition, victims of violence were surveyed to ascertain the health effects of the intervention. The victim’s health state was measured before, 2 weeks after the event, and present using the EQ-5D questionnaire.
The EQ-5D questionnaire is a multi-attribute health status classification system that includes five health attributes: mobility, self-care, usual activity, pain/discomfort, and anxiety/ depression. Each attribute consists of three levels: no problem, some problems, and major problems, defining 245 possible health states including the possible states of unconsciousness and dead (Drummond et al. 1987). The results were converted to a weighted state health index by using values of health profiles from a UK general population study (Dolan et al. 1996). Health gains were reported in quality of adjusted life years (QALYs). QALYs is a generic outcome measure that is calculated by adjusting the length of time affected through the health outcome by the corresponding utility value of the resulting level of health status (Drummond et al. 1987). The costs of implementation included administration (e.g., salaries for project staff, offices, travel, and conferences), studies of alcohol serving practices (i.e., remuneration to actors), community mobilization (e.g., advisory group participation), responsible beverage service training (i.e., 2-day course on responsible beverage service for 572 participants), and stricter alcohol law enforcement (i.e., joint controls by the licensing board and police and increase of notification letters to licensees).
Ma˚nsdotter and colleagues estimated the cost of the program to be 769,000 euros. The average cost of violent crime was estimated to be 19,049 euros, which equates to an approximate saving of 31.314 million euros. Savings were attributed to a reduction in judicial system costs (78%), production losses (15%), health-care issues (5%), and damages issues (2%). The cost saving ratio of the program was 1:39. Overall, health gains were estimated to be 236 QALYs (discounted QALYs), corresponding to 3–4 lives in normal health. As illustrated in the study, the intervention excluding savings was cost-effective in terms of health outcomes (assuming EUR 54,000 per quality of life – 795828/236 is approximately EUR 3,000 per QALY).
McKnight and Streff (1994) assessed the effects of a TPP intervention that enforced laws, using trained servers, to prohibit the service of alcohol to already intoxicated patrons. Specifically, the study addressed the following questions: (1) What is the effect of enforcement upon the service of alcohol to intoxicated patrons? (2) What impact does any change in service to the intoxicated have upon the relative numbers of DWIs coming from bars and restaurants? (3) How do the costs of enforcement relate to the estimated savings yielded by projected reductions in alcohol-related incidents?
The benefits of the intervention were calculated using Eq. 3:
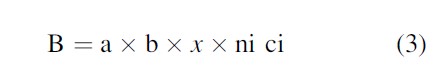
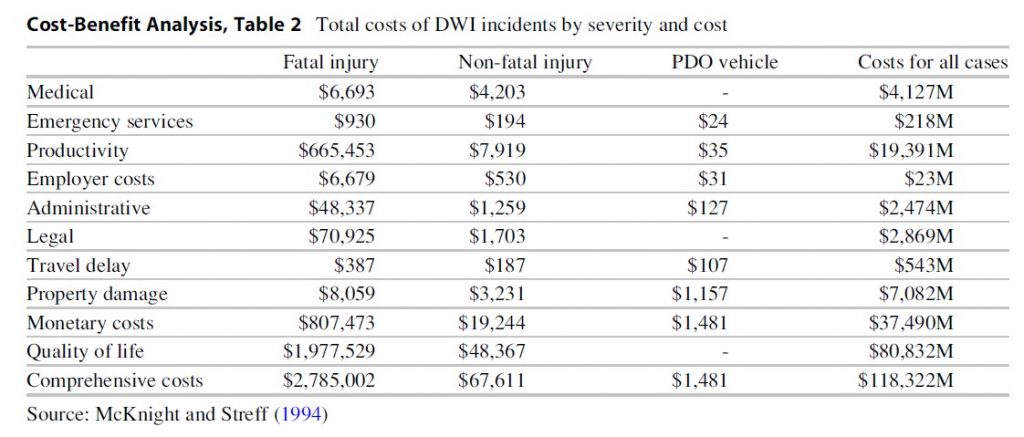
where B represents the benefits fromreduced drinking and driving, a equals the proportional reduction in DWIs (fromtaverns) (0.361), b represents the proportion of current DWIs (from bars andrestaurants) (0.35), x is a factor that controls for the percentage ofalcohol-related incidents that could have occurred in the absence of alcoholconsumption (0.853), and ∑ni ci represents the number of DWI incidents in agiven year multiplied by the average costs per incident ($118.3 billion) (totalcomprehensive costs of all DWI incidents). Table 2 provides a summary of totalDWI incidents by severity and cost.
Results show a cost-savings ratio of 260:1; that is, each dollar invested in the intervention generated a savings of approximately $260. Data for calculating this figure was derived from a study by Levy and Miller (1992), where savings ($260) equals $12.8 billion (total cost to everyone involved in alcohol-related incidents) divided by $48,400 (total cost of effort needed to bring about a decrease in alcohol service violations and DWIs from bars. A number of assumptions were made with respect to estimated savings: (1) only reduced traffic risk was used—this excluded assault, household injury, and other risks associated with alcohol consumption; (2) there was a low percentage of patrons who were refused drinks drinking elsewhere; (3) “traffic safety benefits from refusals of service are confined to reductions of those matching BACs in excess of 0.10%”; (4) Washtenaw County is representative of the United States; (5) the level of enforcement is consistent with the effort as that employed in the Washtenaw County study; and (6) program effectiveness and the benefits of the intervention are the same over time.
Issues To Consider Ex Ante CBA
To highlight the potential limitations of CBAs and emphasize important issues ex ante CBA, the CBA examples presented above are used as an illustration. This discussion is disaggregated by the cost-benefit equation, where the benefitcost ratio (BCR) is calculated by dividing the benefits of a program/intervention (B) by the costs of the program/intervention (C). The reader should note, however, that due to space limitations the discussion is restricted to a sample of limitations (specific to the CBA methodology) that may distort results. Boardman et al. (2006) provide a full discourse of limitations.
The Cost Side Of The Equation
Mansdotter et al.(2007) noted that their cost estimates were based on “.. .account statement,average cost estimates and various kinds of estimations by individuals” (p.622). Costs should not be limited to accounting costs, which are based on anaccount statement. Rather, costs should be economic costs. Economic costsinclude the following: implicit costs (a cost that is represented by lostopportunity in the use of one’s own resources, excluding cash—these aresometimes referred to as intangible costs as they are not easily accounted for,and no actual payment is made) and explicit costs (a direct payment made toanother party in the course of operation, e.g., wage, rent, and materials),where accounting costs only include explicit costs (see Fig. 5).
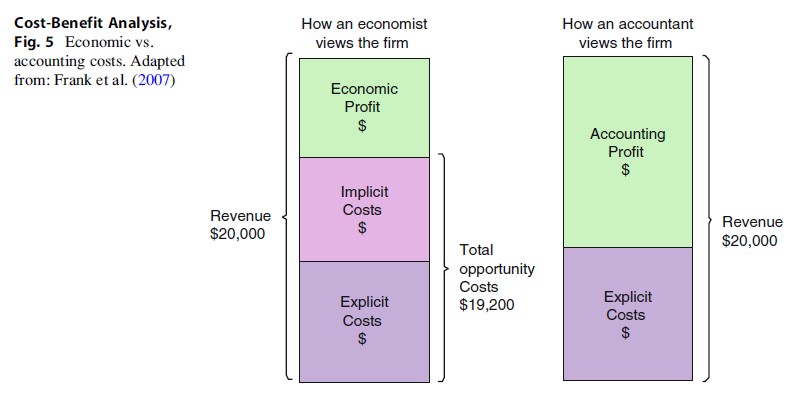
Economic costs are important for a number of reasons: (1) the information contained in accounting budgets does not include all the cost information on all the resources used (e.g., volunteer time, donated equipment and services, and any other unpaid inputs); (2) inputs that have already been paid for, or are not included in the budget, will not be discernable; (3) standard accounting budgets may distort the true cost of an input. That is, accounting budgets typically charge the cost of an input to the year in which the cost occurred. If the life of the asset is, for example, 20 years, then this cost should be distributed over the life of the asset; (4) costs are often embedded in a budget or expenditure statement that is larger than the project in question. For example, costs of an intervention (e.g., police time) may be embedded into the total operational costs of the enterprise, and as a consequence, these must be categorized according to economic classifications (e.g., variable costs); and (5) accounting documents often represent plans for how resources will be allocated as opposed to classifying expenditures after they have been used. That is, accounting statements often include budgeted accounts with actuals being left for inclusion until the end of the accounting period (Levin and McEwan 2001).
Total opportunity costs (TC) (implicit + explicit costs) should be classified into fixed (FC) and variable costs (VC). FCs represent costs that are independent of output (e.g., buildings and machinery). VCs are variable with output. VC generally varies at a constant rate relative to capital and labor. That is, VCs change as the quantity of output changes (e.g., if output = 0, then VC = 0; if output = 1, then output = 50; if output = 2, then output = 100). With this information, we are then able to calculate total costs (i.e., TC = FC + VC).
The Benefits Side Of The Equation
The studies by Ma˚nsdotter et al. (2007) and McKnight and Streff (1994) raise a number of general problems with respect to assessing the benefits resulting from interventions/policies: (1) The first limitation is low response rate (e.g., surveys of victims of violence in the Ma˚nsdotter study). This may be problematic as it potentially influences results in the opposite direction; Ma˚nsdotter and colleagues state, “.. .one may imagine that the most harmed victims are most inclined to respond, but also that the severely harmed hesitated most about answering the questionnaire” (p. 622). (2) The savings and health gains attributed to an intervention are based on a decline in a given variable (e.g., violence). As such, there may be an underestimation in results, for example, spillover effects from not serving alcohol to underage patrons and staff turnover of RBS trained servers in the experimental area. On the other hand, there may be an overestimation where problem drinkers may be displaced to another area (Ma˚nsdotter et al. 2007). (3) Savings may be underestimated when an effectiveness study is limited to given times. For example, violence between 10pm and 6am and DWIs between 11pm and 5am Friday to Sunday. (4) Benefits of an intervention need to be comprehensive, that is, beyond the stakeholder perspective. For example, the Ma˚nsdotter study excluded benefits such as avoided damage and short-time closures. (5) Studies should include the long-term monetary benefits that are gained from an intervention. For example, the study by Ma˚nsdotter asked respondents to restrict their reports to 12 months after the violence—this represents only short-term benefits. (6) Studies should broaden the savings scope to include variables such as administration costs of sick leave and also medication provided by pharmacies (Ma˚nsdotter et al. 2007). (7) QALYs studies should expand their evaluation on a given independent variable. For example, examining whether unlawful threats involve more enduring violence could strengthen a study by potentially uncovering “more costs and health-damaging effects, than non-serious assaults” (Ma˚nsdotter et al. 2007, p. 622). (8) When assessing health gains (using the EQ-5D questionnaire) respondents in the Ma˚nsdotter study were asked to remember and report earlier and current health states. This may be problematic, particularly when respondents report better health at “present” than before the violence. This potential flaw certainly leads to an underestimation of health gains. (9) Studies should ensure that benefits of the intervention are assessed across all groups. For example, Mansdotter et al. (2007) did not include benefits to individuals who were prevented from purchasing alcohol. This may have uncovered both health gains and improvements in non-health-related quality of life (e.g., changes in life events had the individual been arrested for an alcohol-related crime). (10) Studies should be aware of the two potential shortcomings of research that may compromise the internal and the external validity of results, for example, (1) what else, other than participation in the program/intervention may have caused these results and (2) how general or representative are these findings to other groups?
Final Remarks
CBA is a technique that when used properly is a powerful policy decision-making tool. The technique is a little more subtle and sophisticated than most noneconomists recognize, and as such one should be careful in its application. Further, when using the results of CBA to inform public policy, one should understand that economic efficiency/effectiveness is not the only component of the decision-making protocol. Other goals such as equity and fairness should carry weight. Further, the maximization of social benefits that are identified in the economic study must be weighed against other competing interests such as moral and political objectives and how the goals of the system are conceived.
Bibliography:
- Boardman AE, Greenberg DH, Vining AR, Weimer DL (1996) Cost-benefit analysis: concepts and practice, 2nd edn. Prentice Hall, Upper Saddle River
- Boardman AE, Greenberg DH, Vining AR, Weimer DL (2001) Cost-benefit analysis: concepts and practice, 2nd edn. Prentice Hall, Upper Saddle River
- Boardman AE, Greenberg DH, Vining AR, Weimer DL (2006) Cost-benefit analysis: Concepts and practice, 3rd edn. Pearson-Prentice Hall, Upper Saddle River
- Brent R (2008) Applied cost benefit analysis. Edward Elgar Publishing, Northhampton
- Buerger M, Mazerolle L (1998) Third party policing: a theoretical analysis of an emerging trend. Justice Q 15:301–328
- Dolan P, Gudex C, Kind P, Williams A (1996) The timetrade-off method: results from a general population study. Heal Econ 5:141–154
- Drummond MF, Stoddart GL, Torrance GW (1987) Methods for the economic evaluation of health care programmes. Oxford University Press, Oxford
- Frank RH, Jennings S, Bernanke BS (2007) Principles of microeconomics. McGraw-Hill Irwin, Sydney
- Levin HM, McEwan PJ (2001) Cost-effectiveness analysis, 2nd edn. Sage Publications, London
- Levy D, Miller T (1992) A cost-benefit analysis of increased enforcement to reduce serving intoxicated patrons. University of Baltimore and the Urban Institute, Baltimore
- Manning M (2004) Measuring the costs of community-based developmental prevention programs in Australia. Griffith University, Brisbane, Unpublished Masters (Hons)
- Manning M (2008) Economic evaluation of the effects of early childhood intervention on adolescent outcomes. Griffith University, Brisbane, Unpublished PhD
- Manning M, Homel R, Smith C (2006) Economic evaluation of a community-based early intervention program implemented in a disadvantaged urban area of Queensland. Econ Anal Pol 36(1 & 2):99–120
- Manning M, Homel R, Smith C (2011) An economic method for formulating better policies for positive child development. Aust Rev Pub Aff 10:61–77
- Ma˚nsdotter A, Rydberg M, Wallin E, Lindholm A, Andre´asson S (2007) A cost-effectiveness analysis of alcohol prevention targeting licensed premises. Eur J Public Health 17(6):618–623
- McKnight A, Streff F (1994) The effect of enforcement upon service of alcohol to intoxicated patrons of bars and restaurants. Accid Anal Prev 26:79–88
- Mishan E (1972) The futility of pareto efficient distributions. Am Econ Rev 62(5):971–976
- Zerbe R, Bauman Y, Finkle A (2006) An aggregate measure for cost-benefit analysis. Ecol Econ 58(3):449–461
See also:
Free research papers are not written to satisfy your specific instructions. You can use our professional writing services to buy a custom research paper on any topic and get your high quality paper at affordable price.
ORDER HIGH QUALITY CUSTOM PAPER

Always on-time

Plagiarism-Free

100% Confidentiality
