
This sample Economics and Race Research Paper is published for educational and informational purposes only. Like other free research paper examples, it is not a custom research paper. If you need help writing your assignment, please use our custom writing services and buy a paper on any of the economics research paper topics.
Race is a construction of society. These small, observable differences, often in pigmentation and physical characteristics, have, throughout time, played a role in defining and reinforcing other less easily observed differences. This is true both across groups and within groups. However, even using the term groups may be misleading. This spectrum of observable differences has two important consequences. First, unique individuals that may have little else in common are grouped as similar by others. Second, by being treated as a member of said group, one’s own identity of self is altered. This research paper first looks at socioeconomic measures for those defined as members of certain racial groups. Traditional measures such as earnings, education, and segregation present the reader with foundational knowledge of racial differences across time and space. Second, the research paper discusses theories and empirical research that seek to explain these differences across and within these various racial groups, as well as policies seeking to reduce the disparate results.
To analyze the nexus between race and economics, a definition of race is required. Yet defining race as distinct, mutually exclusive categories is misleading at best. Physical characteristics, such as skin color, nose width, and hair texture, are often used to define race. Unfortunately, as any introductory anthropology text will tell you, human characteristics are on a continuous gradient, not in unique categories. Thus, much of the historical data presented and many of the academic works cited use basic categories such as black, white, and Asian in the analysis. New data and innovative researchers have begun to look within these groups, such as Asians with varying types of eyelids and the darkness of skin tone of blacks and African Americans, to gain a better grasp of the importance these subtle differences play within each traditional race category.
Attempting to group individuals into various categories in order to compare across and within groups often requires the use of averages or medians. No one is the average member of a group, and only one in millions is the median of that group. Thus, the average or median of the group one identifies with in no way reflects one’s individual outcome.
One of the difficulties associated with empirical analysis is that correlation does not imply causation. Even though one group may have lower earnings or higher unemployment, this does not necessarily mean that it is due to current or past discrimination. For instance, as demonstrated in this research paper, African Americans have lower annual earnings than Asian Americans. Although one possible explanation may be current discrimination, another plausible hypothesis is that Asian Americans have more years of schooling, more years of experience, or another aspect that may affect the group’s productivity and, therefore, earnings.
Characteristics, such as educational attainment, that affect a person’s earnings may have been subject to past policies. The history of the United States includes a vast number of examples where minority groups have been at a disadvantage compared to settlers who were predominantly white, of northern European origins, and Protestant in faith. Any person who did not match this description had a significantly lower standing in early American society. Blacks were enslaved and perceived as objects, not as human beings; Chinese and Japanese immigrants were abused and denied citizenship, even into the second and third generations; Catholics were often treated with suspicion; and Jews were persecuted. Even the whites of southern or eastern European descent did not enjoy the same privileges and opportunities as the whites of, say, English or German origins. So while it may be the case that discrimination is not present in the current labor market, legacy effects, or past discrimination and social policies, may affect current economic outcomes. Thus, when analyzing differences in outcomes, researchers attempt to include as many current and past characteristics in their analyses as possible.
This research paper first lays out some current and historical statistics on earnings, education, geographic distribution, marital status, and occupational choices of African Americans and whites. It then discusses recent developments in the economic literature on how economists have attempted to explain these differences between African Americans and whites. Next, the research paper focuses on Asian Americans and research seeking to explain their economic welfare. Then this research paper discusses the effects of the Civil Rights Act of 1964 and affirmative action. Because the research paper is about race, it focuses on differences between African Americans, Asians, and whites. Ethnic differences, such as the differences between Cuban and Dominican, or Korean and Chinese, though important because of their unique histories and experiences, are discussed only when the emphasis is on differences within race categories.
Data on African Americans
Figure 55.1 shows the median earnings of full-time, year-round male workers by race in the United States from 1955 to 2007 as reported by the Current Population Survey of the U.S. Census.
These data, reported in real 2007 dollars, show that fulltime, year-round white workers received higher earnings than African American workers. In 1955, the median earnings for full-time white male workers were $29,618, while African American workers earned about 61% of whites’ amount: $18,033. Over time, however, full-time African American workers have witnessed a decline in earnings disparity. By 1980, African American males earned about 70% of male white workers’ earnings. By 2007, the ratio of African American male to white male worker was about 0.78. Although this research paper focuses on differences within the United States, it is important to stress that race also matters in most other countries. For example, African Canadian men earn 18% less than Canadian whites, and nonwhite immigrants in Britain earn less than similarly skilled white immigrants (Howland & Sakellariou, 1993; Stewart, 1983).
Figure 55.2 tells a slightly different story for full-time, year-round female African American and white workers.
In 1955, the median earnings for full-time white female workers were $19,339, while for African Americans, the year’s earnings were about 51% of whites’ amount: $9,933. Over time, however, full-time African American female workers have witnessed a greater decline in earnings disparity than their male counterparts. By 1980, African American females earned about 93% of female white workers’ earnings. By 2007, the ratio of African American female to white female worker had fallen to about 0.86.
These differences are often attributed to racial discrimination. However, at least a portion of this difference may occur even if market participants are not prejudiced. One possible nonprejudicial difference may result from differences in education. Figure 55.3 shows the average years of schooling for African American and white workers in the United States from 1880 to 2000 (Turner, Tamura, & Mulholland, 2008).
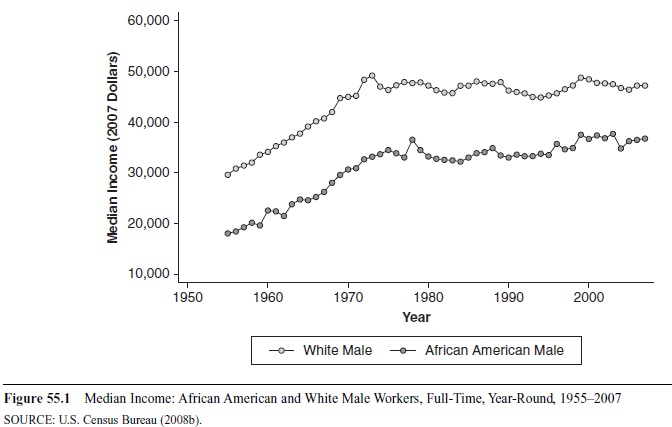 Figure 55.1 Median Income: African American and White Male Workers, Full-Time, Year-Round, 1955-2007
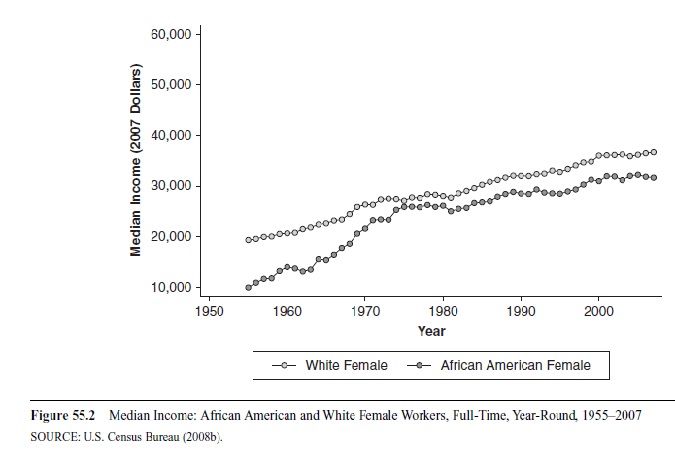 Figure 55.2 Median Income: African American and White Female Workers, Full-Time, Year-Round, 1955-2007
Again, one sees a similar pattern: Whites averaged just over 4 years of schooling in 1880, while African Americans averaged just over one half of a year of schooling. Even with educational disenfranchisement among African Americans in the South, African Americans witnessed an increase in years of schooling. By 1950, the average years of schooling completed by an African American worker were just over 6.5 years. White workers in 1950 had 9.5 years of schooling. In 2000, African American workers possessed just over 12 years of schooling, while whites had completed just over 13 years of schooling. Thus, some of the differences in earnings may be explained by differences in educational attainment.
Furthermore, geography can play a role, especially if local labor markets differ. Table 55.1 shows the geographic distribution of whites and African Americans across the various regions of the United States. African Americans are located primarily in the South, while whites are more concentrated in the Northeast and West. John Bound and Richard Freeman (1992) emphasize that labor is largely immobile in the short run, and these differences in regional location will also shape labor market outcomes, such as earnings. Because African Americans are more highly concentrated in the South, where wages and earnings are lower, a portion of the white-black earnings gap may be due to geographic location.
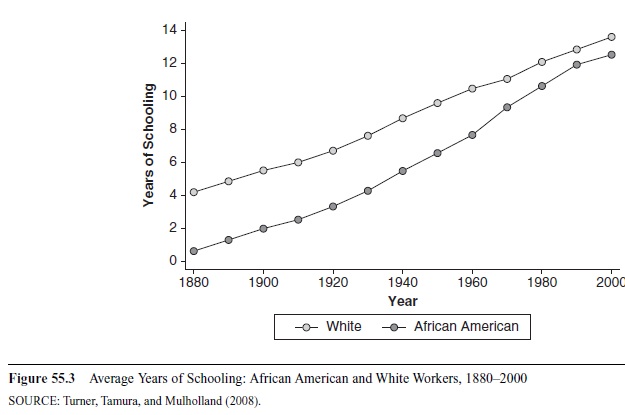 Figure 55.3 Average Years of Schooling: African American and White Workers, 1880-2000 SOURCE: Turner, Tamura, and Mulholland (2008).
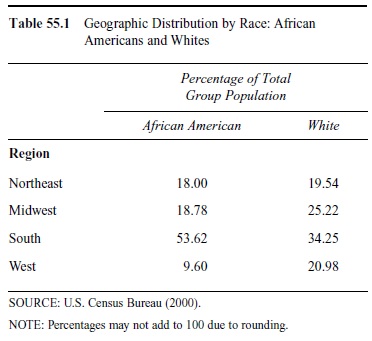 Table 55.1 Geographic Distribution by Race: African Americans and Whites Percentage of Total Group Population
Another factor that affects the incentives and constraints of individuals is their family arrangements. Table 55.2 shows the marital status of African Americans and whites. Whites are much more likely to be married, with their spouse present, than African Americans. In addition, African Americans are much less likely to have ever married. Empirically, studies show anywhere from 0 to a 50% wage premium for married men. Theoretically, this marriage premium could arise from various sources. First, marriage can make men more productive by allowing them to specialize in nonhousehold production. Second, it could be that employers discriminate in favor of married men, and third, it could be that married men possess some unobservable characteristic that makes them more productive. Attempting to eliminate much of the unobservable characteristics, both Harry Krashinsky (2004) and Kate Antonovics and Robert Town (2004) use twin data to study the impact of marriage on wages. Although Krashinsky finds a 6% marriage premium for within-twin estimates, Antonovics and Town find a 27% married wage premium. Because African Americans are less likely to be married, they are either unable to specialize in nonhousehold production or less likely to possess the unobservable characteristic that makes them more productive.
The industry in which one chooses to work may also affect labor market outcomes. Table 55.3 shows the distribution of employment by industry and race. African Americans are more likely to work in industries that face more regulation: transportation and utilities, education and health, public administration, and the armed forces. African Americans are also more likely to work in information and leisure and hospitality. When one compares industrial distribution, the difficulty often arises as to whether occupation is a choice or a constraint. If one believes that firms in certain industries discriminate against certain types of employees, the data above may reflect more of a constraint and less of a decision by those employed.
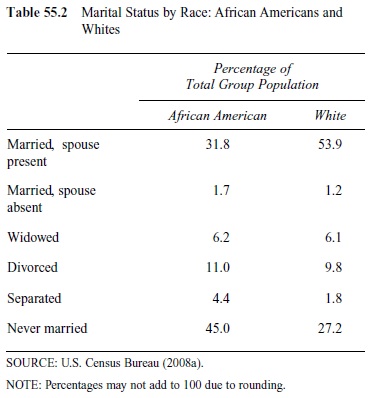 Table 55.2 Marital Status by Race: African Americans Whites
Given that these differences may be choices not affected by race, economists must search for ways to isolate how and where discrimination is possible and, more important, how to disentangle its effects from these and other possible explanations.
Theories of Discrimination
Employer-Based Discrimination
In 1955, Gary S. Becker wrote his Nobel Prize-winning doctoral dissertation on the economics of discrimination. His work advances the theory that discrimination, contrary to the Marxist view, is costly to the individual who discriminates. He hypothesizes that because employer-based discrimination is costly, in the sense that employers must forgo profits in order to pay for their tastes for discrimination, increased competition will lower profits and thus the ability of discriminating firms’ to practice discrimination. According to Becker (1957),
If an individual has a “taste for discrimination,” he must act as if he were willing to pay something, either directly or in the form of a reduced income, to be associated with some persons instead of others. When actual discrimination occurs, he must, in fact, either pay or forfeit income for this privilege. This simple way of looking at the matter gets at the essence of prejudice and discrimination. (p. 14)
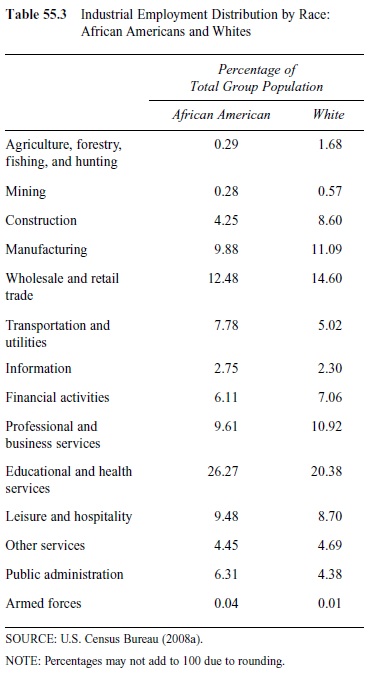 Table 55.3 Industrial Employment Distribution by Race: African Americans and Whites
Therefore, the market structure in the output market affects the ability of individual firms to discriminate. By refusing to hire individuals based on characteristics that have nothing to do with productivity and thereby reducing the pool of possible employees, discriminating firms will, in the long run, face higher labor costs. Increased competition in the output market will force these firms to find lower cost production methods. Increased competition will squeeze higher cost firms, including discriminating firms, out of the market. According to Becker’s theory, only nondiscriminating firms will continue to operate. The result also suggests an important implication for wage equality across races. In the long run, each employee will be paid his or her marginal product multi-plied by the price of the output she or he is producing. Or stated another way, workers will be paid a wage that reflects exactly the value they add to the firm. Without any racial or other type of discrimination, wage gaps between equally skilled and productive whites and non-whites should no longer exist.
This does not mean that average wage inequality across races will disappear or even decline. Kenneth Arrow (1972, 1973) and Edmund Phelps (1972) stress that a skills gap and imperfect information can explain racial wage differentials. African American workers have on average fewer years of schooling; thus, their wages may be lower. One way to test Becker’s (1957) model is to analyze firms that have experienced an increase in competition through an exogenous change in regulation. In the 1970s, the bank-ing system experienced such a regulatory change.
Before the 1970s, banks were unable to operate across state lines. Banking regulations up to this point required banks to operate as independent entities within each state border. Although Bank of America could have branches in any state, each state operation had to operate independently. Customers who wanted to change the address of their accounts were required to open new accounts if they moved across state lines. These restrictions limited banking competition to within the state borders; banks in one state were not in competition with banks in another.
Innovations, such as the automated teller machine, that make distance banking easier weaken the desire and ability of banks to fight regulatory changes that eliminated these state controls. Most states deregulated geographic restrictions on banking between the mid-1970s and 1994, when the federal Riegle-Neal Act effectively eliminated these restrictions. Granting banks the ability to compete across state borders increased the level of competition in the banking industry.
Becker’s theory predicts that such an increase in competition will lead to the elimination or, at least, the reduction of a wage gap that exists due to racial discrimination. To test the validity of that prediction, Ross Levine, Alexey Levkov, and Yona Rubinstein (2008) collected data on earnings of black and white non-Hispanic male workers aged between 18 and 65 from 1977 to 2007. They also compared the actual ratio of interracial marriages in each state from the 1970 census to the same ratio based on hypothetical random pairing of partners to assess the level of racial bias. Their research showed that in the states with high levels of racial prejudice, the increase in market competition significantly reduced the wage gap between African American and white workers. In the states with lower-than-average bias, where the actual and hypothetical interracial marriage ratios were very similar, the reduction was almost unnoticeable. Their results suggest that Becker’s theory holds empirically only when the initial degree of racial bias in the economy is high. If the degree of racial bias is already low, less of the wage differential is due to racial discrimination, and thus, increases in competition will have little effect on racially based wage differentials.
The banking industry is not the only example of increased competition in the output market due to regulatory changes. Looking at the racial wage gap in the for-hire trucking industry, Nancy Rose (1987) finds that increased competition due to deregulation reduced the racial wage gap in the trucking industry. Expanding on this work, James Peoples and Lisa Saunders (1993) find evidence that deregulation reduced the wage gap for both union and nonunion drivers. Peoples and Rhoda Robinson (1996) extend this line of research to the telecommunications industry by showing that the earning disparity between black and white males decreased with the divestiture of AT&T and the resulting increase in competition. John Heywood (1998) examines the effects of deregulation in airlines, trucking, rail, and telecommunications on racial earnings. His results suggest that all industries, except airlines, witnessed a decline in the racial earnings gap.
Becker (1957) writes that, in the long run, discriminating businesses, operating in a competitive market, will become less profitable than the nondiscriminating ones, lose market share, and eventually fail. In response, discriminating firm owners could simply sell their firms, offer their labor for a salary, and earn higher returns. However, rational people seek to maximize their utility, not their monetary earnings alone. Though monetary income has a large effect on utility, prejudiced employers would rather suffer pecuniary losses than employ minority workers. Kerwin Charles and Jonathan Guryan (2007) claim that, because of such preferences, those formerly prejudiced employers would remain prejudiced as employees and work only at firms whose owners were equally prejudiced. In an economy with a significant number of such white, racially biased workers, there might still be some prejudiced firms at which these biased employees will work. If at least one such firm operated, wage gaps could continue to exist.
In the same study, Charles and Guryan (2007) also find that there is a close relationship between the level of prejudice and the magnitude of the wage gap. They construct a prejudice measure by using six questions asked in the General Social Survey (GSS) from 1972 to 2004. These questions included respondents’ “feelings about interracial marriage, their sense of whether racially restrictive housing covenants were appropriate, their views about children being racially segregated in schools, and their view on whether the government should be obligated to help blacks.” They find the racial wage gap to be larger in communities with higher levels of prejudice. Charles and Guryan conclude that the most prejudiced region in the United States is the Southeast, while New England and the West Coast are the least.
Customer-Based Discrimination
Though Becker’s model predicts that increased competition will eliminate employment discrimination in the long run, this is not true for customer discrimination. Customer discrimination exists when customers have and are willing to pay for their discriminatory preferences. If customers wish to avoid contact with a certain group of people, customers will repeatedly pay more to avoid contact with individuals from that group. Lawrence Kahn and Derek Shearer (1988) investigate racial differences in the 1985 to 1986 salaries of individual basketball players and the attendance effects of replacing one black player with a white player. Holding constant various factors, such as productivity, market, and player draft position, they find that black players earn 20% less than white players. In addition, they show that “replacing one black player with an identical white player raises home attendance by 8,000 to 13,000 fans per season” (p. 40).
Even without direct contact, customer discrimination may be present. Clark Nardinelli and Curtis Simon (1990) address this possibility by analyzing the value as listed in the 1989 issue of Beckett Baseball Card Price Guide of Topps baseball cards issued in 1970. Because the two important measures of card value, player’s lifetime performance and the number of cards issued, are easy to measure, they are able to construct a model to determine the effect of race on card value. They find a card value gap of 10% among hitters of comparable ability and a 13% gap in card value among pitchers. Torben Anderson and Sumner La Croix (1991) look at baseball cards from 1977, when the number of cards issued did not vary by player, and find results that support those found by Nardinelli and Simon.
Keith Ihlanfeldt and Madelyn Young’s (1994) work on fast-food restaurants in Atlanta show that a 10-percentage-point increase in white customers reduces African American wages by about 1%. Ihlanfeldt and David Sjoquist (1991) use the racial composition of residents in subcounty areas as proxies for customer composition and find that the racial composition of an employment area affects the type of job held by black workers. Using data from four metropolitan areas, Holzer and Ihlanfeldt (1998) show that racial composition of the customers affects whom employers hire. They find that the magnitude of these effects vary by “occupational category and the degree of direct contact with customers on the job” (p. 862). Holzer and Ihlanfeldt suggest that these differences may be increasing in importance as the distribution of jobs shift from those with little customer contact, such as manufacturing, to those with greater customer contact, such as retail.
Neighborhood Effects
Customer discrimination may also account for the failure of inner-city blacks to migrate to the suburbs (Kain, 1968). Transportation difficulties or information limitations may also result in spatial mismatches (Holzer, Ihlanfeldt, & Sjoquist, 1994). Unfortunately, discrimination in the credit market may reduce the ability of blacks to move households or businesses. Faith Ando (1988) finds blacks are less likely to be approved for loans even after accounting for various factors that influence approval rates. David Blanchflower, Phillip Levine, and David Zimmerman (2003) find that “black-owned firms, in particular, are substantially more likely to be denied credit than other groups and are charged higher interest rates for those loans that are approved than are other firms that are otherwise comparable” (p. 930). Furthermore, a study of the Boston mortgage market during the early 1990s reveals substantial racial differences in the likelihood that a mortgage application would be rejected, even after controlling exhaustively for differences in credit history and various other factors (Munnell, Tootell, Browne, & McEneaney, 1996).
The lack of migratory ability leads to another possible reason for differences in earnings discussed in a vast literature on peer group effects or social interaction and neighborhood effects (Borjas, 1995; Case & Katz, 1991; Glaeser, Sacerdote, & Scheinkman, 1996). Building on this work and the work of Kain (1968), David Cutler and Edward Glaeser (1997) find African Americans in segregated communities are worse off than those in nonsegregated communities. Cutler and Glaeser show that a one-standard-deviation reduction in segregation would eliminate one third of the education and earnings gap between whites and blacks.
Statistical Discrimination
Statistical discrimination, first described by Arrow (1972, 1973) and Phelps (1972) and further developed theoretically by Joseph Altonji and Charles Pierret (2001), occurs when an individual’s estimated productivity is based on the group to which he or she is categorized and not by his or her individual characteristics. William Wilson (1996) reveals that both black and white employers are reluctant to hire young, black urban males. In addition, “statistical discrimination can be quite damaging to both the efficiency of market allocations and to equity. This is due to the very real possibility that the empirically valid statistical generalizations lying at the heart of such discrimination can be self-fulfilling prophecies” (Loury, 1998, p. 123; see also Coate & Loury, 1993; Lundberg & Startz, 1983).
Recent Research on African American Discrimination
These categorizations can be based on a large range of factors. Racial stereotypes that are the bases of prejudices are often identified with one or more physical characteristics. But as suggested theoretically by Kevin Lang (1986), speech patterns and nonverbal communication may also be a source of discrimination. A recent study of speech patterns carried out by Jeffrey Grogger (2008) collected the phone recordings from interviews for the National Longitudinal Survey of Youth and removed all the information that could reveal each interviewee’s gender, race, and age. He then asked people to identify the speaker of each recording as either black or white. Comparing the reported earnings of the black interviewees identified as sounding black to those black interviewees identified as sounding white, he finds that blacks who sound black earn 10% less than blacks who do not. In comparison, whites who sound black earn 6% lower salaries than whites who do not.
Not only does it appear that African American-sounding speech may be associated with wage differentials, but a person’s name may also play a role. Marianne Bertrand and Sendhil Mullainathan (2003) test whether having a typically white-sounding name is more advantageous for job applicants than having a black-sounding name. Using the frequency of names given to African American and white newborns in the state of Massachusetts between 1974 and 1979, they sent four resumes to each job posting in The Boston Globe and the Chicago Tribune. Each group of four resumes, which included detailed information, had two of high quality and two of low quality. One high-quality and one low-quality resume were always given distinctly African American names, while the other two would always get white-sounding names.

Resumes with white-sounding names had a callback rate of 10%, while black-sounding names had a rate of only 6.7%. The results suggest that an applicant with a white-sounding name can, on average, expect an invitation for a job interview for every 10 resumes submitted, while an applicant with an African American-sounding name will only receive 1 for every 15. This result suggests that employer-based discrimination plays a role in the interview process.
However, statistical discrimination and neighborhood effects may also be present. Bertrand and Mullainathan’s (2003) experiment also looks at the effect a person’s address has on whether an applicant receives an invitation for an interview. Consistent with neighborhood effects, applicants whose neighborhood residence was whiter, with higher earnings and levels of education, realized a greater callback rate than those whose address represented the lower earning, less educated, predominately African American neighborhoods. However, living in a whiter, higher earning, more educated area neighborhood does not help the applicants with distinctively black names very much.
Moreover, employers seemed to be more willing to acknowledge the difference between high- and low-quality white applicants than differences between high- and low-quality African American applicants. High-quality white applicants received invitations for interviews from about 11% of their applications, while low-quality white applicants received invitations from only 8.8%. In contrast, high-quality blacks experienced a callback rate of just less than 7%, while low-quality blacks received callbacks on 6.4%.
Speculating that distinctively African American-sounding names convey information about socioeconomic background, Roland Fryer and Steven Levitt (2004) seek to determine consequences and causes of black-sounding names. Using California birth certificates, they collected data on the first names given to black and white non-Hispanic newborns between 1961 and 2000. Using these data, they created the black name index (BNI) to measure the distinctiveness of a given name by dividing the fraction of black children given that name over the fraction of both black and white children receiving the exact name. Babies born in predominantly black hospitals, over time, were more likely to receive distinctively black names than those born in predominantly white hospitals. Blacks living in segregated neighborhoods were more likely to give their children distinctively black names than those living in integrated communities. Moreover, a woman’s first name can indicate to her potential employer the circumstances she grew up in and her current situation, both of which can imply her labor productivity. Fryer and Levitt also found that a woman with a BNI of 100 (a name that no whites have) is 20.9% more likely to have been born to a teenage mother and 31.3% more likely to have been born out of wedlock than a similar black woman with a BNI of around 50. Once a potential employer realizes that a resume has been submitted by an individual with a distinctively black name, he or she has a reason to believe the applicant has poor credentials without reading it in detail. This could explain why black applicants receive so few callbacks, regardless of their qualifications. If this is employer-based discrimination, instead of statistical discrimination, then the employers simply reject the applicant because of their taste for discrimination.
Focus on African Americans versus white, however, may miss a subtle yet important difference in how various shades of discrimination are expressed. Preferences for those with lighter pigmentation have been cited by historians who show that both whites and lighter skinned blacks often found ways to maintain distinct social networks (Gatewood, 2000). These culturally defined restrictions have serious consequences. Robert Margo (1992) finds that light-complected slaves were more likely to receive skill training. Shawn Cole (2005) reports that 40% of freed slaves were mulattoes, and less than 6% of slave sales in late eighteenth- and early nineteenth-century Louisiana involved mulatto slaves.
Looking at Los Angeles neighborhoods in the 1900s, James Johnson, Elisa Bienenstock, and Jennifer Stoloff (1995) discover that the combination of black racial identity and a dark skin tone reduces an individual’s odds of working by 52%, after controlling for education and including quality, age, and criminal record. A lighter complexion is also associated with higher incomes and life chances than a darker complexion in blacks in the United States (Keith & Herring, 1991; Ransford, 1970). Andrew Goldsmith, Darrick Hamilton, and William Darity Jr. (2006) find that blacks with lighter-colored skin earn higher wages than black workers whose skin color is identified as medium and dark. The wage gap between medium-skinned blacks and whites is 16%; the wage gap between dark-skinned blacks and whites is 17%. In comparison, the gap between light-skinned blacks and whites is only 7.6%.
Data on Asian Americans
Repeating the data exercise performed with African Americans but substituting data on Asian Americans reveals a different story. Even though it has been fewer than 70 years since some of their ancestors were held in internment camps, Asian Americans seem to be faring better than the population at large.
These data, reported in real 2007 dollars, show that fulltime, year-round white and Asian American male workers have, at least for the last 20 years, similar earnings.
In 1988, the median earnings for full-time white male workers was $47,598, while for Asian Americans, the yearly earnings were about 99% of whites’ earnings: $47,287. Over time, however, full-time Asian American male workers have witnessed slightly higher earnings growth than white male workers. By 2007, Asian American males earned about 108% of what white male workers earned.
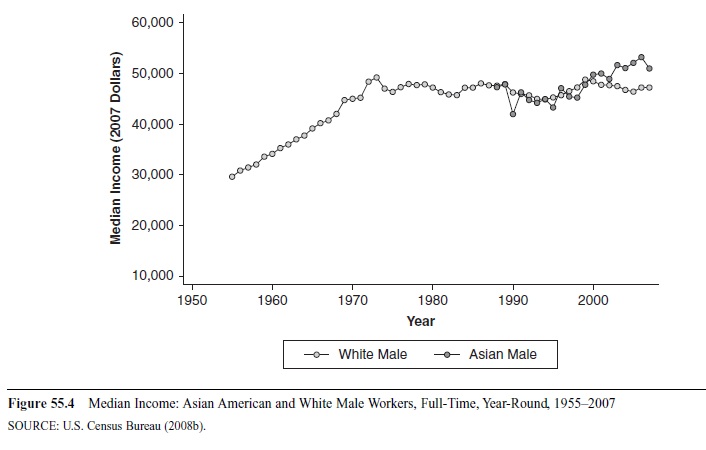 Figure 55.4 Median Income: Asian American and White Male Workers, Full-Time, Year-Round, 1955-2007 SOURCE: U.S. Census Bureau (2008b).
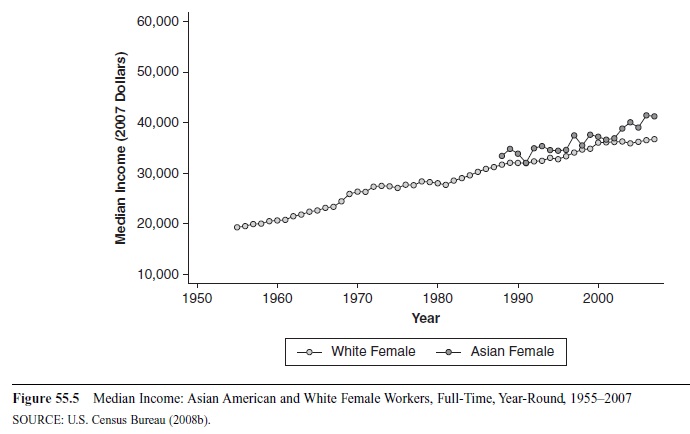 Figure 55.5 Median Income: Asian American and White Female Workers, Full-Time, Year-Round, 1955-2007 SOURCE: U.S. Census Bureau (2008b).
Figure 55.5 shows a similar story for full-time, year-round female Asian American workers relative to their white female counterparts.
In 1988, the median income for full-time white female workers was $31,701, while Asian American women earned about $33,426. By 2000, Asian American females earned about 104% of what white female workers earned. By 2007, the ratio of Asian American female earnings to white female worker earnings was about 1.12.
Presenting the difference in education will help to suggest why both Asian American females and males now earn more than their respective white colleagues. Figure 55.6 shows the average years of schooling for Asian American and white workers in the United States from 1940 to 2000 (Ruggles et al., 2008)
In the 1940s, whites had just over 7 years of schooling, while Asian Americans had just fewer than 6.9 years of schooling. By 1980, Asian Americans had on average obtained more years of schooling than whites. The ratio of the average years of schooling for Asian Americans relative to whites was 1.04. From 1980 to 2000, this ratio varied little.
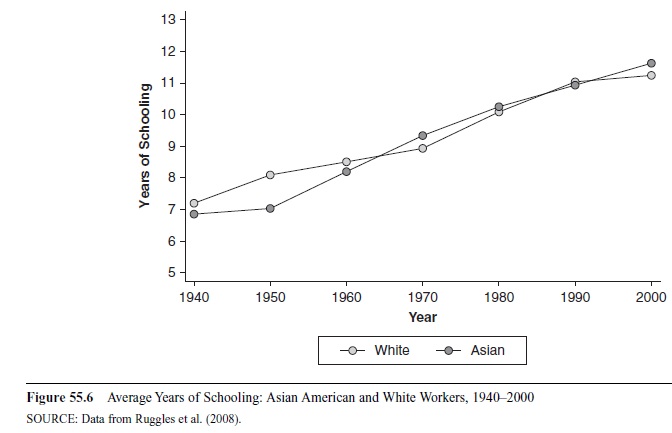 Figure 55.6 Average Years of Schooling: Asian American and White Workers, 1940-2000 SOURCE: Data from Ruggles et al. (2008).
Geography can also play a role, especially if local labor markets differ. Table 55.4 shows the geographic distribution of whites and Asian Americans across the various regions of the United States. Asian Americans are primarily located in the west and northeast, much like their fellow white citizens, where wages and earnings are higher.
Another factor that affects the incentives and constraints of individuals is their family arrangement. Table 55.5 shows the marriage status of Asian Americans and whites. As presented above, empirically, studies show anywhere from 0 to a 50% wage premium for married men. Because Asian Americans are more likely to be married and less likely to be divorced than white Americans, Asian Americans can more easily specialize in nonhousehold production, or they are more likely to possess the unobservable characteristic that makes them more productive. Asian Americans are also less likely to be divorced than whites.
Industry of choice may also affect labor market outcomes. Table 55.6 shows the distribution of employment by industry and race. Although Asian Americans are more likely than whites to work in some industries that face greater regulation, such as education and health, they are also more likely to work in industries that face much less regulation: manufacturing, information, financial, professional and business services, leisure and hospitality, and other services. As mentioned above, the difficulty often arises as to whether occupation is a choice or a constraint. If one believes that firms in certain industries discriminate against certain types of employees, the data above may reflect a constraint and not a decision by those employed.
Research on Asian American Discrimination
The data presented in Table 55.6 suggest that Asian Americans have attained higher levels of earnings, education, and family stability than the overall population, the other minorities, or both. A study conducted by Barry Chiswick in 1983 seems to reinforce the idea that Asian Americans have achieved higher socioeconomic welfare. Using data from the 1970 census of population, which identifies Asian Americans by their origins—Chinese, Japanese, and Filipino—Chiswick compares U.S.-born Asian male workers’ earnings and employment to a control sample of U.S.-born whites. Chiswick finds that Asian American men had higher levels of earnings, employment, and education in 1969 than white men. In aggregate, the Asian Americans earned about $10,000, while white men earned only $9,900; Asian Americans had completed more schooling (12.6 vs. 11.9 years), and worked more hours (48.7 vs. 48.3 weeks). However, only 77% of Asian American men were married and living with their wives, compared to a rate of 86% for white men.
Within the Asian American group, the Chinese Americans and Japanese Americans performed better in all categories than the whites; however, the Filipino Americans fared worse. In 1969, Chinese Americans earned $10,400, had completed 13.1 years of schooling, and worked 47.6 weeks; the Japanese Americans earned $10,300, had been in school for 12.7 years, and worked 49.4 weeks. The Filipino Americans earned only $7,000, had completed 11.3 years of schooling, and worked 46.8 weeks. After controlling for human capital, demographics, and geographic area variables, the weekly earnings for those of Chinese, Japanese, and Filipino origins were lower than those of the whites by 2%, 4%, and 16%, respectively. But because both Chinese Americans and Japanese
Americans worked more weeks than the whites, their annual earnings were higher. On the other hand, the Filipino Americans had both significantly lower weekly earnings and more workable hours. Chiswick (1983) concludes that those of Chinese and Japanese origin, despite being minorities, are as successful in the labor market as whites and therefore do not suffer any discrimination.
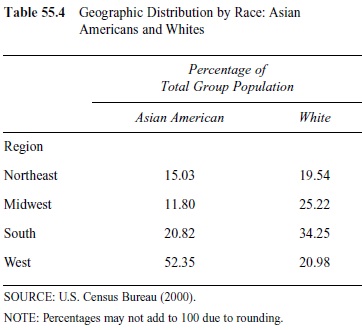 Table 55.4 Geographic Distribution by Race: Asian Americans and Whites
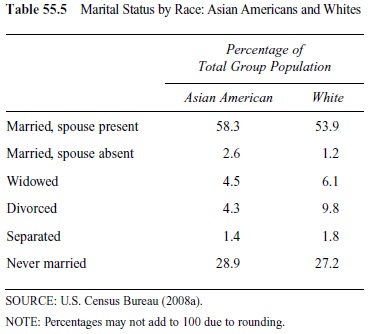 Table 55.5 Marital Status by Race: Asian Americans and Whites
Pramod Junakar, Satya Paul, and Wahida Yasmeen (2004) claim that the results obtained by Chiswick (1983) might not be very accurate because “estimates of discrimination based on studies of earnings are likely to be underestimates as they usually ignore the probability of finding employment in the first place” (p. 6). However, the year analyzed by Chiswick, 1969, was a year of full employment, with the unemployment rate of only 2.1%—the lowest in the post-World War II period. Therefore, the probability of being without a job was very small, regardless of race or ethnicity.
Even though Chiswick (1983) finds no evidence of discrimination against the Chinese and Japanese born in the United States and some researchers have subsequently concluded similarly, others have found that Asian Americans still earn less than similarly educated whites. One explanation for this discrepancy is the heterogeneity within Asian Americans. Although Chinese Americans and Japanese Americans tend to do well with respect to education and earnings, other nationalities, such as the Filipino Americans and southeastern Asians do not fare as well. The combination of these Asian subgroups into one large category creates the gap between the Asian Americans in general and whites in data from the 1970s.
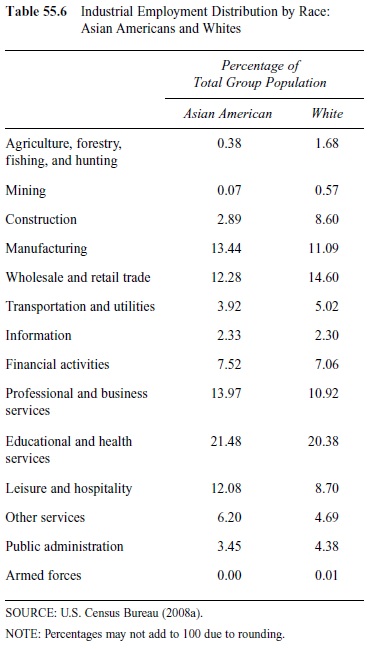 Table 55.6 Industrial Employment Distribution by Race: Asian Americans and Whites
Another possible weakness of Chiswick’s (1983) study is the exclusion of foreign-born Asian Americans. A study conducted by Zhen Zeng and Yu Xie (2004) looks at place of birth and education to explain why there is no consensus on whether the Asian Americans have lower or higher earnings than whites and, if they do, why this gap in earnings exists between similarly educated Asian Americans and whites. Using 1990 census data supplemented with data from the National Survey of College Graduates, they divide Asian American male workers into three distinct groups: U.S.-born Asian Americans (UBA), U.S.-educated Asian immigrants (UEAI), and foreign-educated Asian immigrants (FEAI). FEAI are compared to the UEAI to assess the effects of the place of education on earnings, UEAI to UBA for the effects of nativity, and UBA to U.S.-born whites (UBW) for the effects of race.
Zeng and Xie (2004) show that UEAIs have 2 more years of schooling and 37% higher earnings than FEAI. In addition, one third of UEAIs work in professional occupations, while only 13% of FEAIs do. Although Asian Americans have higher earnings overall than whites, they earn less at each level of education, which means they have to obtain more education in order to have parity in earnings. UEAIs earn more than FEAIs but still less than UBAs. That said, it seems as though earnings differ both by nativity and by place of education. The results from the two models show that UBWs have the highest earnings, followed UBAs (5% less than UBW), UEAIs (5% less than UBA), and FEAIs (16% less than UEAI). However, only the difference between UEAI and FEAI is statistically significant. Although the effects of race and nativity are very small and negligible, where Asian Americans are educated has a substantial effect on their earnings. The results show that much of the discrimination of Asian Americans is directed against the immigrants, especially those who have completed their education prior to arriving in the United States. This suggests that Chiswick’s (1983) decision to only include U.S.-born Asian Americans may be driving his results.
Chiswick’s (1983) results might also be biased because he includes wages, salaries, and earnings from self-employment. Using data from the 1992 Characteristics of Business Owners (CBO) survey, Alicia Robb and Robert Fairlie (2007) show that Asian American-owned firms are 20.6% more likely to have profits of $10,000 or more, 27.2% more likely to have employees, and have 60% higher sales than white-owned businesses. Asian American-owned firms also have higher survival rates: an 18% probability of closure versus 23% for white-owned firms. By including self-employed Asian Americans, who on average are much more successful than the typical owner, Chiswick’s results might be upwardly biased. Moreover, people who are self-employed usually do not face the kind of discrimination from their employers that wage and salary earners face; thus, including business owners in an attempt to measure employer discrimination may reduce the likelihood of findings even if customer and statistical discrimination is present.
Because the growth of the Asian population in the United States is a recent phenomenon, there are relatively few studies that analyze the labor market outcome experienced by Asian Americans. The few studies available seem to disagree as to whether Asians in the United States are subject to discrimination in the labor market. The problems that scholars have to confront are lack of adequate data and the heterogeneity of the Asian group in terms of their ethnicity, nativity, and education.
Policy
Two policies most often cited as having the greatest impact on racial discrimination are the Civil Rights Act of 1964 and affirmative action. Before the enactment of the Civil Rights Act of 1964, employment and contractual actions based on race were legal. The act established the Equal Employment Opportunity Commission (EEOC) and prohibits employment discrimination by large employers (more than 15 employees), whether or not they have government contracts. The resulting reduction in the black-white wage gap was large and abrupt (Card & Krueger, 1992; Donohue & Heckman, 1991).
Though the Civil Rights Act of 1964 sought to prohibit current discrimination, affirmative action was developed to overcome persistent disparate outcomes. The result was a system of preferences for minority college applicants, minority job applicants, and minority-owned businesses. Affirmative action has generated much debate on both constitutional and equity grounds. Although space here does not allow for a thorough discussion of the challenges to current court decisions or a thorough presentation of research looking at the redistributive and efficiency effects of affirmative action, a few noted theoretical and empirical studies are presented.
Finis Welch (1976) develops a theoretical model with taste-based discrimination and a quota-based system to show that affirmative action may cause unskilled workers to be assigned to skilled positions and vice versa. Lundberg and Startz (1983) develop a model to show that affirmative action can increase efficiency in human capital investment but lower efficiency in the labor market, result-ing in an ambiguous net effect. Coate and Loury (1993) find that affirmative action can, theoretically, have negative effects on those it seeks to help. They show that if “identifiable groups are equally endowed ex ante, affirmative action can bring about a situation in which employers (correctly) perceive the groups to be unequally productive, ex post” (p. 1220).
Empirically, Jonathan Leonard (1984a) finds no negative productivity effects on federal contractors after affirmative action implementation. Leonard (1984b) finds that the share of employment accounted for by minorities rose at contractor establishments covered by affirmative action between 1974 and 1980, while those accounted for by white males declined. Using microlevel data, Holzer and David Neumark (2000b) discover that employers using affirmative action in job searches recruit “more extensively and screen more intensively” and “are more likely to ignore stigmatizing personal characteristics and histories when they hire” (p. 269). These affirmative action hires, however, come at the expense of white males, who see a 10% to a 15% decline in employment at these establishments.
In a meta-analysis of sorts, Stephan Thernstrom and Abigail Thernstrom (1997) report that black enrollments as a percentage of all enrollments in schools, excluding historically black colleges and universities, rose from 1.8% in 1960 to 9.0% in 1994. William Bowen and Derek Bok (1998) report that from 1960 to 1995 the percentage of blacks aged 25 to 29 who had graduated from college rose from 5.4% to 15.4%. Looking at data for selective institutions, Frederick Vars and Bowen (1998) and Bowen and Bok (1998) find some evidence that test scores are worse predictors for blacks. Thus, because African Americans with similar standardized test scores to whites’ perform better in college and are more likely to graduate than their white classmates, affirmative action may have simply reduced the bias present in the college application process.
Although the program may place slightly less qualified individuals into positions and possibly lead to negative fit or stigma effects, it may also create positive externalities. Minorities benefiting from affirmative action may generate social benefits, such as working in underserved areas, which do not generate private pecuniary benefits. Overall, Holzer and Neumark (2000a) conclude, “Affirmative action offers significant redistribution toward women and minorities, with relatively small efficiency consequences” (p. 559).
Conclusion
Race continues to play a role in whether and how employees are hired and compensated, the level of education one receives, and where and how one lives. As has been shown, many of these effects can be measured in various manners. Competitive markets can, theoretically in the long run, reduce employer-based discrimination and eliminate earnings and wage differences based on characteristics that have no effect on labor productivity. However, customer and statistical discrimination can persist. Unfortunately, discrepancies in employment opportunities, wages, neighborhood effects, and loan approval can simply occur because of one’s name, accent, address, or physical characteristics. Even with equal opportunity legislation and (or despite) affirmative action, African Americans appear to experience a greater difference in earnings relative to whites and Asian Americans.
See also:
Bibliography:
- Altonji, J. G., & Pierret, C. R. (2001). Employer learning and statistical discrimination. Quarterly Journal of Economics, 116(1), 313-350.
- Anderson, T., & La Croix, S. J. (1991). Customer racial discrimination in Major League Baseball. Economic Inquiry, 29, 665-677.
- Ando, F. (1988). Capital issues and the minority-owned business. Review of Black Political Economy, 16(4), 77-109.
- Antonovics, K., & Town, R. (2004). Are all the good men married? Uncovering the sources of the marital wage premium. American Economic Review, 94(2), 317-321.
- Arrow, K. (1972). Some mathematical models of race in the labor market. In A. H. Pascal (Ed.), Racial discrimination in economic life (pp. 187-204). Lexington, MA: Lexington Books.
- Arrow, K. (1973). The theory of discrimination. In O. A. Ashenfelter & A. Rees (Eds.), Discrimination in labor markets (pp. 3-33). Princeton, NJ: Princeton University Press.
- Becker, G. S. (1957). The economics of discrimination. Chicago: University of Chicago Press.
- Bertrand, M., & Mullainathan, S. (2003, January). Are Emilyand Greg more employable than Lakisha and Jamal? A field experiment on labor market discrimination (Poverty Action Lab Paper No. 3). Cambridge: MIT.
- Blanchflower, D. G., Levine, P. B., & Zimmerman, D. J. (2003). Discrimination in the small business credit market. Review of Economics and Statistics, 85(4), 930-943.
- Borjas, G. (1995). Ethnicity, neighborhoods, and human capital externalities. American Economic Review, 85(3), 365-390.
- Bound, J., & Freeman, R. (1992). What went wrong? The erosion of the relative earnings and employment among young black men in the 1980s. Quarterly Journal of Economics, 107, 201-232.
- Bowen, W. G., & Bok, D. (1998). The shape of the river. Princeton, NJ: Princeton University Press.
- Card, D., & Krueger, A. B. (1992). School quality and black-white relative earnings: A direct assessment. Quarterly Journal of Economics, 107(1), 151-200.
- Case, A. C., & Katz, L. F. (1991). The company you keep: The effects of family and neighborhood on disadvantaged youths (NBER Working Paper No. 3705). Cambridge, MA: National Bureau of Economic Research.
- Charles, K. K., & Guryan, J. (2007). Prejudice and the economics of discrimination (NBER Working Paper No. W13661). Cambridge, MA: National Bureau of Economic Research.
- Chiswick, B. R. (1983). An analysis of the earnings and employment of Asian-American men. Journal of Labor Economics, 1(2), 197-214.
- Coate, S., & Loury, G. C. (1993). Will affirmative-action policies eliminate negative stereotypes? American Economic Review, 83(5), 1220-1240.
- Cole, S. (2005). Capitalism and freedom: Manumissions and the slave market in Louisiana, 1725-1820. Journal of Economic History, 65(4), 1008-1027.
- Cutler, D., & Glaeser, E. (1997). Are ghettos good or bad? Quarterly Journal of Economics, 112(3), 827-872.
- Donohue, J. J., III, & Heckman, J. (1991). Continuous versus episodic change: The impact of civil rights policy on the economic status of blacks. Journal of Economic Literature, 29(4), 1603-1643.
- Fryer, R., & Levitt, S. (2004). The causes and consequences of distinctively black names. Quarterly Journal of Economics, 119 (3), 676-805.
- Gatewood, W. B. (2000). Aristocrats of color: The black elite, 1880-1920. Fayetteville: University of Arkansas Press.
- Glaeser, E. L., Sacerdote, B., & Scheinkman, J. A. (1996). Crime and social interactions. Quarterly Journal of Economics, 111(2), 507-548.
- Goldsmith, A., Hamilton, D., & Darity, W., Jr. (2006). From dark to light: Skin color and wages among African Americans. Journal of Human Resources, 42(4), 701-738.
- Grogger, J. (2008, July). Speech patterns and racial wage inequality (Harris School Working Paper No. 08.13). Chicago: University of Chicago. Heywood, J. S. (1998). Regulated industries and measures of earnings discrimination. In J. Peoples (Ed.), Regulatory reform and labor markets (pp. 287-324). Boston: Kluwer Academic.
- Holzer, H. J., & Ihlanfeldt, K. (1998). Customer discrimination and the employment outcomes of minorities. Quarterly Journal of Economics, 113(3), 833-865.
- Holzer, H. J., Ihlanfeldt, K. R., & Sjoquist, D. L. (1994, May). Work, search, and travel among white and black youth. Journal of Urban Economics, 320-345.
- Holzer, H. J., & Neumark, D. (2000a). Assessing affirmative Journal of Economic Literature, 38, 483.
- Holzer, H. J., & Neumark, D. (2000b). What does affirmative action do? Industrial Labor Relations Review, 53(2), 240-271.
- Howland, J., & Sakellariou, C. (1993). Wage discrimination, occupational segregation and visible minorities in Canada. Applied Economics, 25(11), 1413-1422.
- Ihlanfeldt, K. R., & Sjoquist, D. L. (1991). The role of space in determining the occupations of black and white workers. Regional Science and Urban Economics, 21(2), 295-315.
- Ihlanfeldt, K. R., & Young, M. V (1994). Intrametropolitan variation in wage rates: The case of Atlanta fast-food restaurant workers Review of Economics and Statistics, 76(3), 425-433.
- Johnson, J. H., Jr., Bienenstock, E. J., & Stoloff, J. A. (1995). An empirical test of the cultural capital hypothesis. Review of Black Political Economy, 23(4), 1-27.
- Junakar, P. N., Paul, S. & Yasmeen, W. (2004, June). Are Asian migrants discriminated against in the labour market? A case study of Australia (IZA Discussion Paper No. 1167). Bonn, Germany: Institute for the Study of Labor.
- Kahn, L., & Shearer, D. (1988). Racial differences in professional basketball players’ compensation. Journal of Labor Economics, 6(1), 40-61.
- Kain, J. D. (1968). Housing segregation, Negro employment, and metropolitan decentralization. Quarterly Journal of Economics, 82,175-197.
- Keith, V, & Herring, C. (1991). Skin tone and stratification in the black community. American Journal of Sociology, 97, 760-778.
- Krashinsky, H. A. (2004). Do marital status and computer usage really change the wage structure? Journal of Human Resources, 29(3), 774-791.
- Lang, K. (1986). A language theory of discrimination. Quarterly Journal of Economics, 101(2), 363-382.
- Leonard, J. (1984a). Anti-discrimination or reverse discrimination? The impact of changing demographics, Title VII, and affirmative action on productivity. Journal of Human Resources,19(2), 145-174.
- Leonard, J. (1984b). Impact of affirmative action on employment. Journal of Labor Economics, 2(4), 439-463.
- Levine, R., Levkov, A., & Rubinstein, Y. (2008). Racial discrimination and competition (NBER Working Paper No. 14273). Cambridge, MA: National Bureau of Economic Research.
- Loury, G. C. (1998). Discrimination in the post-civil rights era: Beyond market interactions. Journal of Economic Perspectives, 12(2), 117-126.
- Lundberg, S., & Startz, R. (1983). Private discrimination and social intervention in competitive labor markets. American Economic Review, 73(3), 340-347.
- Margo, R. A. (1992). Civilian occupations of ex-slaves in the Union army, 1862-1865. In R. W. Fogel & S. L. Engerman (Eds.), Without consent or contract: Markets and production: Technical papers, Vol. 1 (pp. 170-185). New York: W. W. Norton.
- Munnell, A. H., Tootell, G. M., Browne, L. E., & McEneaney, J. (1996). Mortgage lending in Boston. American Economic Review, 86(1), 25-53.
- Nardinelli, C., & Simon, C. (1990). Customer racial discrimination in the market for memorabilia: The case of baseball. Quarterly Journal of Economics, 110, 575-595.
- Peoples, J., & Robinson, R. (1996). Market structure and racial and gender discrimination: Evidence from the telecommunications industry. American Journal of Economics and Sociology, 55, 309-326.
- Peoples, J., & Saunders, L. (1993). Trucking deregulation and the black/white wage gap. Industrial and Labor Relations Review, 47, 23-35.
- Phelps, E. S. (1972). The statistical theory of racism and sexism. American Economic Review, 62, 659-661.
- Ransford, E. (1970). Skin color, life chances, and anti-white attitudes. Social Problems, 18, 164-178.
- Robb, A., & Fairlie, R. (2007, January). Determinants of business success: An examination of Asian-owned businesses in the United States (IZA Discussion Paper No. 2566). Bonn, Germany: Institute for the Study of Labor.
- Rose, N. L. (1987). Labor rent sharing and regulation: Evidence from the trucking industry. Journal of Political Economy, 95, 1146-1178.
- Ruggles, S., Sobek, M., Alexander, T., Fitch, C. A., Goeken, R., Hall, P. K., et al. (2008). Integrated public use microdata series: Version 0[Machine-readable database]. Minneapolis: Minnesota Population Center. Retrieved October 20, 2008, from http://usa.ipums.org/usa
- Stewart, M. B. (1983). Racial discrimination and occupational attainment in Britain. Economic Journal, 93(371), 521-541.
- Thernstrom, S., & Thernstrom, A. (1997). America in black and white: One nation, indivisible. New York: Simon & Schuster.
- Turner, C. S., Tamura, R., & Mulholland, S. E. (2008). Productivity differences: The importance of intra-state black-white schooling differences across the United States, 1840-2000 (MPRA Paper No. 7718). Munich: University Library of Munich, Germany.
- S. Census Bureau. (2000). Census 2000. Available at http://www.census.gov/main/www/cen2000.html
- S. Census Bureau. (2008a). Current population survey, annual social and economic supplement. Available at http://www.census.gov/cps
- S. Census Bureau. (2008b). Historical income tables: People (table P-36). Available at http://www.census.gov/hhes/ www/income/histinc/incpertoc.html
- Vars, F. E., & Bowen, W. G. (1998). Scholastic aptitude, test scores, race, and academic performance in selective colleges and universities. In C. Jencks & M. Phillips (Eds.), The black-white test score gap (pp. 457-479). Washington, DC: Brookings Institution.
- Welch, F. (1976). Employment quotas for minorities. Journal of Political Economy, 84(4, Pt. 2), S105-S139.
- Wilson, W. J. (1996). When work disappears: The world of the new urban poor. New York: Knopf.
- Zeng, Z., & Xie, Y. (2004). Asian-Americans’ earnings disadvantage reexamined: The role of place of education. American Journal of Sociology, 109(5), 1075-1108.
Free research papers are not written to satisfy your specific instructions. You can use our professional writing services to buy a custom research paper on any topic and get your high quality paper at affordable price.
ORDER HIGH QUALITY CUSTOM PAPER

Always on-time

Plagiarism-Free

100% Confidentiality
