
This sample Environmental/Occupational Risk Assessment Research Paper is published for educational and informational purposes only. If you need help writing your assignment, please use our research paper writing service and buy a paper on any topic at affordable price. Also check our tips on how to write a research paper, see the lists of health research paper topics, and browse research paper examples.
Introduction
Risk assessment is an increasingly common tool used to evaluate or compare hazards to human health and the natural environment. We will not further discuss ecological risk assessment. Risk assessors estimate the probability that a hazard will affect health and explore the magnitude of the consequences if it does. There are two basic kinds of risk assessment: The kind that presupposes the release or occurrence and tries to estimate exposure and potency; and the kind (once called PRA) that adds a preliminary step of the probability that the stressor will even occur (e.g., fault tree analysis). This research paper assumes the former type of risk assessment. For discussion of the latter, see Kammen and Hassenzahl (1999). Risk analysis has ancient origins (Covello and Mumpower, 1985), but as an organized undertaking may be traced to the London insurance industry in the sixteenth century (Bernstein, 1998). Over the past four decades, risk assessment has been identified as a useful organizing principle and decision tool for a broad range of management and policy problems.
Controversy surrounding decisions where risk analysis features prominently can be intense. The stakes and interests are often high in such cases, and putting weight on analyses that rely on expert knowledge and judgment can in some cases heighten conflict. This is especially relevant when uncertain scientific information must be coupled to highly controversial assumptions. (Some basic references expressing support for or antipathy to risk assessment, respectively, include Arrow et al. (1996) and Ackerman and Heinzerling (2004)).
In this research paper, we briefly present the evolution of risk assessment over the past four decades, describe fundamental risk assessment methods, and summarize how risk assessment is and can be used to inform environmental and public health decisions. We conclude with current challenges and controversies associated with risk assessment.
Risk Assessment In The Federal Government
Beginning in the late 1960s and increasing with major health and environmental legislation in the early 1970s, risk assessment became a standard tool for evaluating the impacts of physical, biological, and chemical agents. By the mid-1980s, risk assessment had become a familiar regulatory tool for major agencies, including the Food and Drug Administration (FDA), the Environmental Protection Agency (EPA), and the Occupational Safety and Health Administration (OSHA). Concern about its ad hoc origins and diverging evolution in these different agencies, however, led to a desire to standardize practice and language.
In 1983, a National Research Council (NRC) panel completed a review of standard risk assessment practice, with recommendations for future applications (National Research Council, 1983), which came to be known as the Red Book. Figure 1 recreates the best-known figure from the Red Book, depicting risk assessment as a linear process, with four steps that have become a standard regulatory risk assessment paradigm. These steps are:
- hazard identification (the qualitative identification of which potential threats to health can be caused by particular physical, biological, or chemical agents);
- exposure assessment (the estimation of human exposures to those agents);
- dose–response assessment (the estimation of the potency, the probability of a particular kind of harm per unit of exposure to the agent or agents);
- risk characterization (a description of the expected impacts of the agents on health, along with quantitative and qualitative descriptions of uncertainty).
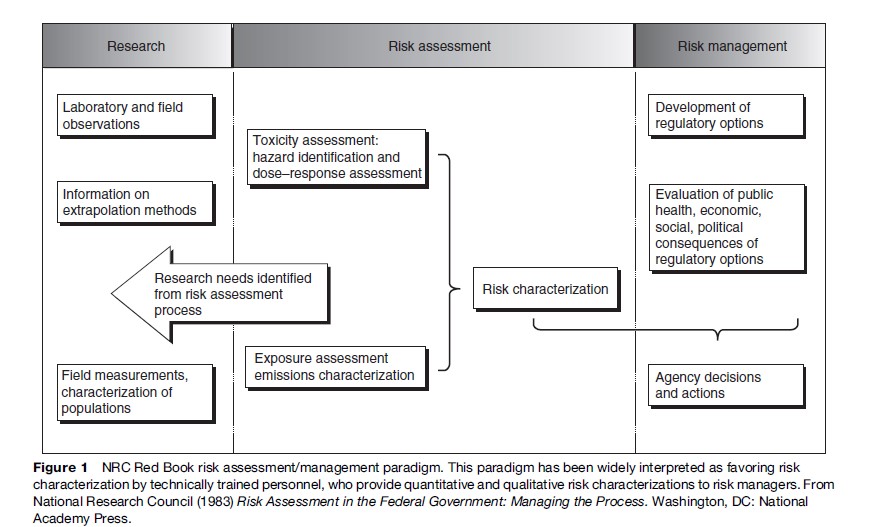
One of the most significant, but arguably most misunderstood, recommendations of the Red Book Committee was its warning that risk managers should not pollute the risk assessment process by imposing policy preconceptions upon scientific inquiry. The committee was reacting to concerns that political appointees at EPA were exerting undue influence on risk assessments for certain high-profile chemicals. The Red Book therefore recommended a conceptual separation between assessment and management, with assessors freed up to generate risk characterizations faithful only to the underlying science. However, some observers (including some on the committee) believed further that an organizational separation between assessment and management was necessary; most agencies either retained or created such firewalls between these two functions. More recently, original Red Book Committee members and others have lamented the bureaucratic separation of assessment and management – an excellent collection of essays on this and related topics can be found in a special issue of Human and Ecological Risk Assessment ( Johnson and Calabrese, 2003) marking the 20th anniversary of the publication of the Red Book. Some of these commenters (notably Hattis and Goble, 2003) further question even the wisdom of the strict conceptual separation, noting that analyses performed in a vacuum cannot hope to actually help decision makers discriminate among risk-reducing choices, and recommending that analysts and managers can and should communicate better across the firewall.
The major set of Red Book recommendations about the techniques of risk assessment itself concerned the use of inference options, the assumptions that assessors make in order to bridge knowledge gaps and allow the assessment to proceed despite uncertainty. For example, assessors commonly assume, in the absence of specific and compelling data to the contrary, that adverse health effects produced in laboratory animals would occur at comparable exposures in humans. This default assumption is grounded in the experience of many previous assessments where it has been shown to be reasonable and is supported by substantial biological understanding and theory. It is nonetheless an assumption that, while expedient, may not in fact be valid in a given case.
The Red Book Committee strongly endorsed the use of default assumptions, a position reaffirmed in a second major NRC report, Science and Judgment in Risk Assessment (National Research Council, 1994). This report urged EPA to codify its default assumptions and their scientific bases, and to develop a clear set of guidelines governing what quantity and quality of evidence will be sufficient to supplant each default assumption with a specific alternative. Science and Judgment also suggested that the Red Book’s four-stage linear process map was not the only conceptual framework for risk assessment and developed a complementary way to look at the process based on six cross-cutting issues that arise within each of the stages. This committee gave special emphasis to two of these themes – uncertainty and interindividual variability in risk – echoing emphasis that had been made in the contemporary academic risk literature.
Later, driven by concerns about disenfranchising the public from the process, the NRC convened another panel, whose 1996 report envisioned risk assessment as a ‘‘mutual and recursive … analytic deliberative process … among .. . all interested and affected parties’’ (National Research Council, 1996: 1–9). Ideally, in this model, the nature of the risk management decision helps determine the nature and rigor of the risk assessment, and analysts and decision makers provide regular feedback to ensure technically sound and decision-relevant risk characterizations.
Risk assessment practice in most agencies continues to be a hybrid of methods and is often highly contentious. Critics from the regulated community complain that risk assessment assumptions chronically overestimate probabilities and effects on human health and safety, because, they claim, the default assumptions tend to ascribe non-zero risks to exposures that are absolutely harmless. In addition to this potential for qualitative bias, many observers of risk assessment procedures also argue that at many steps along the process, assessors introduce a conservative bias to the quantitative estimation of risk. (Influential writings on the problem of conservatism in risk assessment include Nichols and Zeckhauser (1986), Breyer (1993), and Perhac (1996), as well as two minority reports in Science and Judgment presenting differing views on the subject.) On the other hand, many scientists and environmental advocates assert that if anything, the risk regulatory system is biased in favor of industry and business interests (Montague, 1999). Further, conservatism in some assumptions (if it exists at all) is not arbitrary but serves to offset missing effects such as interactions and mixtures and to account for the certainty that some individuals will be more susceptible to environmental disease than the average laboratory animal or the average member of an epidemiologic study population (Finkel, 1989, 1995).
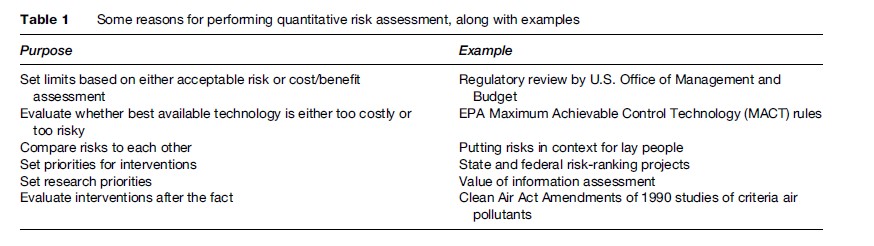
The debate over whether current risk assessment procedures in fact tend to yield conservative results has both empirical and ethical dimensions, including the appropriateness of the precautionary principle and the protection of susceptible populations. The debate has enormous practical import because the uncertainties are so large; two risk estimates that differ wildly and that would lead to vastly different regulatory responses may both be compatible with the underlying science. Covello and Merkhofer (1993) note that different assumptions can lead to overor underestimation of risk estimates by as much as five orders of magnitude, while Hassenzahl (2005) explores the policy implications of applying different assumptions. The fragility of risk estimates famously led William Ruckelshaus, the first Administrator of EPA, to state that ‘‘we should remember that risk assessment data can be like the captured spy: if you torture it long enough, it will tell you anything you want to know’’ (Ruckelshaus, 1984). The science of risk assessment has improved greatly in the past 10–20 years, however, and the range of plausible estimates has generally narrowed as some very conservative assumptions as well as some implausibly rosy scenarios positing zero risk have fallen by the wayside. Moreover, an increasing number of practitioners and critics have come to understand that in large part, the range of plausible answers for risk-assessment questions reflects the real variation in risk estimates within affected populations, which no amount of research can reduce. Table 1 summarizes several purposes of quantitative risk assessment, along with some examples of those applications.
Risk Assessment Methods
Basic Risk Calculations
Risk assessment methods tend to focus on computing the probability that some event or outcome will occur, and the associated consequence, over a given period of time (eqn [1]). Alternatively, risk is calculated as the product of the exposure to some chemical, physical, or biological agent and the potency of that agent (eqn [2]). These two equations yield risk estimates in similar units: Adverse outcomes per unit time. For example, one might say that the risk to workers of losing a finger in a particular industrial setting is one lost digit in every 10 000 operations (1 in 10 000); here, operations is a proxy for time. Alternatively, in an environmental setting, one could calculate the risk of getting cancer from exposure to a pesticide to be one chance in one million per year of exposure at some fixed concentration. In the latter case, since cancer has a long latency, risk is often reported as lifetime risk.
![]()
![]()
In order to calculate risks, assessors must have reasonably well-specified estimates of the input parameters: Probabilities, consequences, exposures, and potencies. Unfortunately, there are rarely data or empirically validated theoretical relationships to allow precise estimates. Thus assessors must use some combination of existing data, new data, existing theory, or new theory to estimate parameters. For some common risks – such as automobile accidents per year per 10 000 male drivers aged of 18–25 in a particular city – historical data may be sufficient to reasonably predict future trends. For less common, long latency, and very low-dose risks, calculations may be considerably less certain due to incomplete understanding of processes.
Identifying Hazards
The first logical task along the Red Book’s four-step paradigm for risk assessment is to assess what type of adverse effect(s) an agent is capable of causing. Hazard identification organizes the causal evidence, pro and con, for one or more hazard–effect relationships, so that assessors can narrow down the range of necessary exposure assessment and dose–response analyses. In occupational settings, a range of outcomes is often considered: Reduced lung capacity, lost workdays, or death. In environmental settings, death is often the focus of calculations, with the (often hidden) assumption that other adverse outcomes are either dominated by or will scale with numbers of deaths. Moreover, in occupational settings, the levels of concern tend to be higher than for environmental settings (as are prevailing levels of contaminants, often by a factor of 1000 or more). These differences arise in part from the perception that workplace exposures are voluntary, or at least are well understood by those exposed.
Procedures for evaluating the strength and weight of evidence in order to identify agents as capable or incapable of causing a particular effect are most well developed for cancer hazard identification. Table 2 summarizes the carcinogen classification system developed by the International Agency for Research on Cancer (IARC), a unit of the World Health Organization. IARC applies this system, using a series of expert panel deliberations, to chemicals, mixtures, and exposure conditions. The key feature of this system is the separate evaluation of the strength of evidence (as either sufficient, less than sufficient, limited, or inadequate) in both animal bioassays and in human epidemiologic studies; the confidence that each signal of carcinogenicity is positive determines the overall evaluation of human cancer potential. The U.S. EPA and the U.S. National Toxicology Program classify carcinogens using a very similar system and often (but not always) reach the same conclusions.
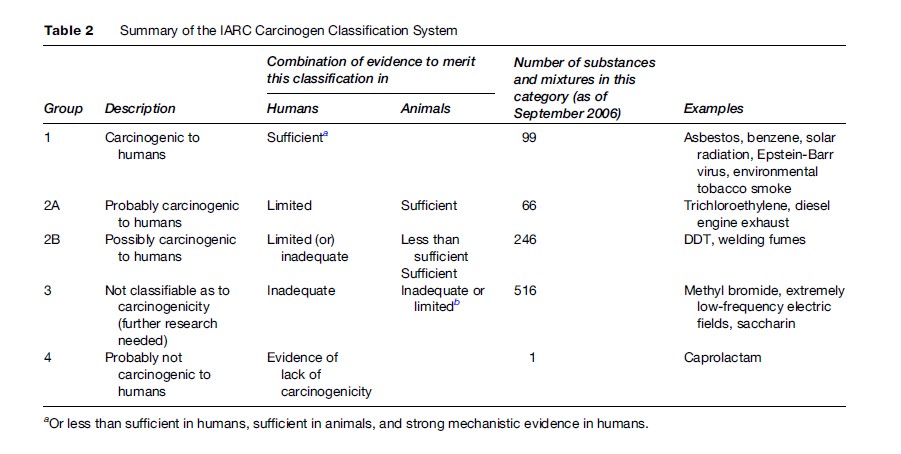
Among the various issues that make carcinogen classification controversial, two in particular may interest readers. First, Table 2 should clearly indicate that IARC considers human data more influential than animal data. Without positive human data, it is very unlikely that a substance or agent will be classified as a known human carcinogen, but with such evidence, no amount of animal data suggesting lack of carcinogenicity will sway the classification. Given the ethical constraints and the practical implausibility of conducting lifetime cancer bioassays on humans, it is therefore epidemiology that drives carcinogen classification. This in turn has a powerful but often unappreciated influence: It is substantially easier to detect a statistically significant increase in cancer risk if an agent happens to cause a rare tumor type as opposed to a common one. For this reason, many of the known human carcinogens cause rare tumors, such as angiosarcoma of the liver (vinyl chloride). It is possible, however, that many substances classified only as possible or probable actually are as potent, but increase the incidence of common tumors (perhaps of the colorectum or prostate) that are harder to notice above the natural background.
A more recent controversy involves the interpretation of mechanistic data. Such data can be used either to upgrade or downgrade a classification. In practice, however, the latter outcome has predominated. Several prominent substances have received lower classifications because of in vitro or other data, suggesting that sufficient evidence in animals should be discounted as irrelevant to humans. For example, EPA has concluded that certain agents (notably unleaded gasoline) cause kidney tumors in male rats but would not do so in humans because of a fundamental physiological difference between the two species. Less often have mechanistic data been used to successfully argue that despite limited epidemiological evidence, a substance should be considered a human carcinogen given a combination of clear carcinogenicity in animals and evidence showing that humans share the relevant biochemical pathways. As hazard identification systems continue to improve, a more balanced treatment of ancillary data may emerge.
Exposure Assessment
Human exposure occurs when a physical, chemical, or biological agent reaches a body boundary. Exposure assessment covers a variety of steps from the introduction of an agent into the environment to the points within the body where the agent can have adverse effects. The three primary avenues of human exposure are ingestion, inhalation, and dermal absorption. Exposure is a complex process, that may be governed by a variety of parameters. For many air or water-borne contaminants, emissions cannot be measured directly, but must be estimated, using a combination of model assumptions and mass-flow calculations. Once contaminants are in the environment, their fate (chemical changes) and transport (physical movement) must be modeled. Finally, exposure assessors must understand the processes by which the agent crosses boundaries into the body (lungs, digestive tract, or skin/ membranes) and the fate and transport of the agent within the body, as well as behavioral factors that affect the duration and intensity of exposure. For example, the amount of a volatile solvent contaminating a household water supply that an individual will inhale while showering is a function of, among other things, the duration of the shower and the temperature of the water used.
Dose–response relationships derived from toxicological, epidemiological, or other analyses often relate some measure of dose, such as concentration of an agent in the amount of food consumed, to observed adverse outcomes. However, it is important to differentiate the route of exposure, since different agents will cross body boundaries at different rates. A substance that enters the digestive system but is eliminated without ever being absorbed has, from a cell biologist’s perspective, never actually entered the body. Thus, exposure assessors differentiate between intake, which is the amount of the agent ingested or inhaled, and uptake, which is the amount of the agent that crosses a body boundary.
This leads to four different concepts of dose. A potential dose is the amount of a substance ingested or inhaled (or, for example, contained in mud that comes in contact with skin). Somewhere between all and none of a potential dose may become an applied dose, which is the amount of an agent available at a body boundary. An applied dose becomes an internal dose if and when it crosses a barrier and enters the body. Finally, some fraction of the internal dose may be metabolized or otherwise eliminated (or an otherwise-benign substance may be activated by metabolic enzymes), and so the fraction that actually contacts the tissue or organ of concern is considered to be a biologically effective dose. Allometric scaling is the (well-developed) default approach to assessing the fate and transport of chemicals in the body, and physiologically based pharmacokinetic (PBPK) methods are often used to model the transfer, metabolism, and elimination of agents in the body. Clewell et al. (2002) provide a succinct explanation of allometry and PBPK modeling.
As an example of the potential complexity of exposure assessment, consider the information needed to estimate exposure to hydrocarbons in a paint manufacturing facility:
- atmospheric fate and transport modeling, to understand what concentrations are found at different locations;
- inhalation rates of workers at different locations and/or engaged in different activities;
- absorption rate through lungs, skin, and eyes;
- transport and metabolism in blood;
- transfer rates from blood to organs and tissues of concern;
- elimination rate in the body.
Regulatory agencies have developed and published extensive data sets over the last two decades that describe the range of exposures to foods, products, workplace conditions, and other potential sources of risk. Many of these are cataloged in the EPA Exposure Factors Handbook, which is updated regularly (EPA, 2006). These demonstrate substantial inter-individual variability determined by age, gender, ethnicity, and other demographic variables. Increasingly, regulatory risk calculations try to account for this variability, which can be used to identify potential ‘‘high risk’’ subpopulations.
Dose–Response Assessment
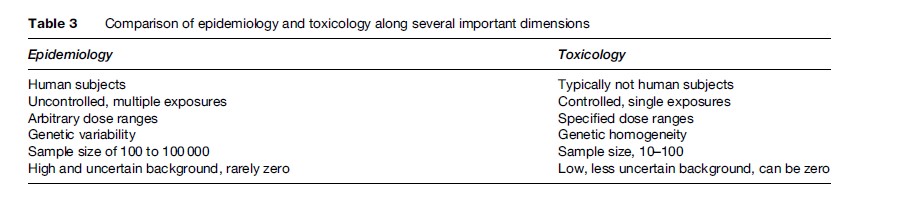
Toxicology and epidemiology are the primary information sources for estimating potency, or dose–response relationships. Each method has distinct advantages and limitations. Toxicology evaluates the effects of (usually single) agents under controlled laboratory conditions, with the goal of identifying safe dose levels or establishing dose–response relationships. Epidemiology identifies potentially causal correlations between agents and outcomes in human populations, and, if the exposure information is sufficient, can quantify the relationship between exposure and adverse effect(s).
Ideally, risk assessors use toxicology and epidemiology in concert to arrive at robust conclusions about potency. Unfortunately, information from different sources can be contradictory or inconsistent. For example, toxicologists might conclude that airborne particulate matter is only of concern if it contains trace metals or organic chemicals, while epidemiologists find evidence associating all particulate matter with increased incidence of lung disease. This section explores the applications, advantages, and disadvantages of each approach. Table 3 compares toxicology and epidemiology along a number of dimensions. In the following sections, we describe how toxicology and epidemiology are used independently to arrive at potency estimates for various chemicals. It is important to keep in mind that toxicology and epidemiology share many commonalities and limitations. For example, both historical human exposures available to epidemiologists and laboratory exposures applied by toxicologists tend to be higher than doses observed in real settings, with some exceptions in occupational settings. Even when extensive complementary data are available, the dose–response relationship often remains unclear. For example, there are multiple animal data sets at several dose levels for benzene, as well as data on historical benzene exposures in a variety of industrial settings. It is clear that benzene causes certain types of cancer in humans at high levels. Nonetheless, the risk of human health effects from benzene at concentrations recorded in regulated industries remains difficult to quantify precisely.
Toxicology For Risk Assessment
Toxicology involves intentional exposure of individuals (typically animals, rarely but occasionally humans) or parts of organisms (cells, tissue cultures) to controlled amounts or concentrations of potentially harmful agents. As such, toxicology can provide highly specific information about the effects of single agents at concentrations that are determined precisely by the investigators, as opposed to epidemiology, where generally the exposures have already occurred and must be estimated retrospectively. Animal testing allows researchers to observe effects over multiple generations as well as different stages of disease or injury.
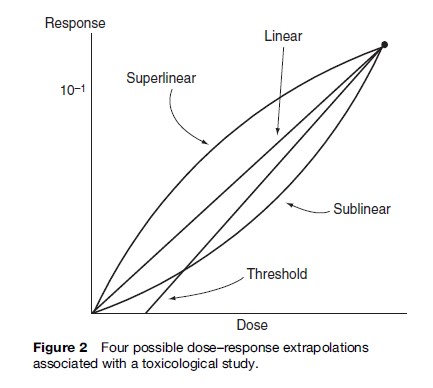
Toxicological studies, however, have several disadvantages. Laboratory exposure levels are typically considerably higher than those experienced in the general environment, although they may in some cases not exceed concentrations actually encountered in the workplace. Therefore, estimates associated with lower-dose effects require extrapolation. Extrapolation can be highly contentious, especially over the question of thresholds. Figure 2 depicts four possible examples of extrapolation to a low dose from a hypothetical one-exposure animal study.

Additional uncertainties arise from using toxicological studies. First, while animals serve as proxies for humans, they are not entirely analogous. Second, dosing frequency in toxicological studies is likely to differ from those in exposures of concern. Animal test doses for chronic outcomes are often artificially regular, using a single exposure route. Third, such tests typically cover only the healthy adult fraction of the animal’s life, excluding the first 12 weeks when the animal might be particularly susceptible and sacrificing the animals several months before they might otherwise succumb to old age. In effect, therefore, we test laboratory animals from the time they are ‘toddlers’ to ‘retirement age,’ and thereby learn little about the risks to human infants and octogenarians. Fourth, while toxicology allows specificity through controlling parameters other than dose (including, for example, other chemicals, food, ambient temperature, feeding times, space allotment, and lighting), this artificial control omits possible amplifying or offsetting effects of multiple agent exposures.
Risk assessors use toxicological data (and sometimes epidemiological data) to calculate risks in two substantially different ways: To derive a dose–response relationship down to a very low dose (typically the goal when cancer is the endpoint), or to determine a safe dose for chronic non-cancer endpoints.
An assumed or derived continuous (often linear) dose–response function can be used to relate exposure to risk across a range of exposures. This approach is most often applied to cancer risks associated with chemical or physical agents and results in probabilistic estimates. Even in cases where dose–response is not thought to be linear, a linear approximation is often used for low dose levels. The assumption of low-dose linearity has a substantial foundation in both theory and evidence, although at very low doses, finding statistically significant evidence supporting linearity can be difficult (Peto et al., 1991). Crawford and Wilson (1996) observed that low dose linearity can be expected for both cancer and noncancer endpoints. Likewise, while linear functions strictly imply some non-zero excess risk even at infinitesimal dose, in practice EPA does not extrapolate more than 2–5 orders of magnitude below the substantial doses administered in animal bioassays. In other words, the true dose–response function may be nonlinear below environmental levels, but that would be irrelevant to risk estimation for human health.
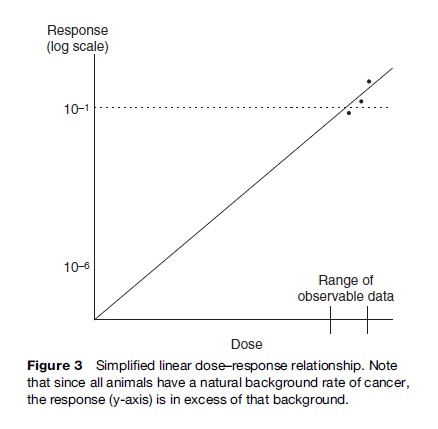
Doses are often expressed in terms of mass of agent per unit of time, normalized to body weight and time, for example mg/day. Alternatively, continuous airborne exposure is typically given in terms of concentration in the air: Respiration rate and body weight can be used to convert this to mass per unit of time. An example of a dose–response function is provided in Figure 3. Dose (exposure) is depicted on the horizontal axis and response on the vertical axis. Typically, response is in units of probability, ranging from 0 to 1. Alternatively, response can be in absolute terms, such as number of affected individuals or total number of tumors.
Potency, then, is expressed in terms of increased risk per unit dose. With a linear assumption for the dose–response function at concentrations of concern, this allows a simple calculation of risk as lifetime cancer probability (LCP) (eqn [3]):
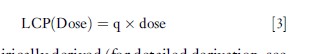
where q is empirically derived (for detailed derivation, see Kammen and Hassenzahl (1999), Cox (1995), or Gratt (1996)). Since LCP is a unitless probability, q has units that are the inverse of dose, e.g.(mg/kgBW/day)–1. q may also be referred to as the unit risk factor.
Converting high-dose animal studies to exposures associated with human responses of concern (typically around 1 in 10 000 to 1 in 1 000 000 in environmental settings and as high as 1 in 100 for occupational settings) requires several steps. First, animal doses must be converted to comparable human doses. Second, a human-health conservative assumption is often made, for example, an upper 95th percentile response associated with each dose or an upper 95th percentile response associated with the set of doses. Third, some theoretical or practical assumption about the dose–response relationship is made; often this is simplified to linear extrapolation from the smallest dose. Finally, potency is calculated as the slope of this line, through some background expectation of response (no response, lowest observed response, or some other value) at zero dose. Once potency is established, the estimated LCP associated with any dose can be easily calculated. Alternatively, a dose associated with some LCP of concern (e.g., 1 in 10 000) can be calculated by dividing that LCP by potency.
The second common approach to calculating risk from toxicological data assumes some threshold dose level below which adverse effects are not expected. The U.S. EPA establishes a reference dose (Rf D) for various chemicals, which is used as a benchmark for regulations involving the chemical. The RfD is defined as ‘‘an estimate, with uncertainty spanning perhaps an order of magnitude, of a daily oral exposure to the human population (including sensitive subgroups) that is likely to be without an appreciable risk of deleterious effects during a lifetime’’ (Environmental Protection Agency, 2007). In other regulatory settings, the related idea of safe doses – or doses at which adverse effects are not expected in humans – is used, for example, the acceptable daily intake (ADI) used at the FDA.
The RfD or other safe dose usually begins with some critical observation, such as the no observed effect level (NOEL), no observed adverse effect level (NOAEL), lowest observed effect level (LOEL), or a benchmark dose associated with a particular probability of response in the population (Rhomberg, 2004). In order to translate this animal-based reference point into a human reference point, several adjustment factors must be introduced, to account for issues such as statistical certainty and quality of data, interspecies variation, intraspecies variation, multigenerational effects, and use of LOEL as opposed to NOEL. Individual safety factors (EPA calls these uncertainty factors (UFs), even though they are meant to adjust the animal NOAEL or LOAEL to a human dose with a margin of safety and do not specifically relate to the amount of uncertainty in the adjustment) typically take the values 1, 3, or 10. A safe dose (RfD, ADI or other) then, may be calculated as in eqn [4]:
![]()
Here, Experimental Dose is the relevant dose from the empirical study (e.g., NOEL, LOAEL) and UF = PUF(1.. .n), where UFi are the various uncertainty factor components. For the EPA, 10 ≤UF≤3000.
Current controversies regarding the NOAEL-plusuncertainty-factors approach center on three issues:
- whether the individual safety factors are too large (see, e.g., Dourson et al., 1996) or too small (see, e.g., Hattis et al., 1999) to serve their intended purpose of estimating a dose that provides a reasonable certainty of no harm;
- whether the NOAEL itself is a safe dose in the test animals or merely one that does not significantly elevate disease rates above background;
- whether the paradigm itself is valid or whether instead assessors should strive to estimate continuous dose–response relationships for non-carcinogens as they do for carcinogens (see, e.g., Baird et al., 1996).
Epidemiology For Risk Assessment
Epidemiology studies human populations to evaluate relationships between exposures and adverse (or beneficial) outcomes. Among the advantages of epidemiology is that it looks at effects on humans, so assumptions about relationships among species are not necessary. In addition, because at times data sets can be very large, effects of relatively small doses can sometimes be evaluated. However, humans vary substantially in susceptibility to disease and injury, as well as in their behaviors.
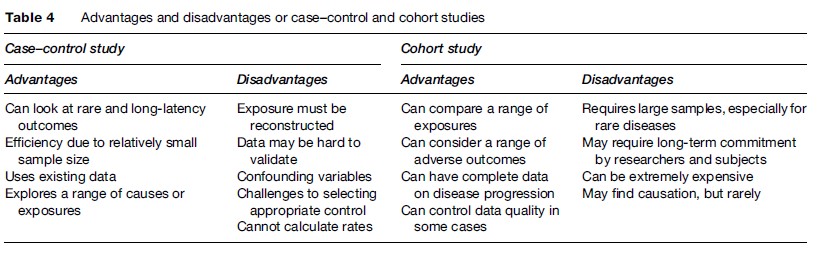
Case–control studies and cohort studies are the two primary types of epidemiology that provide useful inputs to risk assessors. Case–control studies start with information about a group of individuals who have some condition and compare these to a group of otherwise similar individuals who do not have the condition. Differences observed among the two groups, then, particularly those involving environmental/occupational exposures, suggest possible causal relationships. Case–control studies are particularly useful for examining rare effects.
While case–control studies segregate on the basis of effects, cohort studies differentiate between or among exposures. Cohort studies compare a group (or cohort) of individuals who have some common historic exposure or other suspected risk factor to an otherwise similar group of individuals who were not exposed to that particular agent. Among the advantages of cohort studies is that they can explore a range of possible adverse effects, often at relatively common exposure levels. However, unless the cohort is very large, it is difficult to identify rare diseases. Table 4 summarizes advantages and disadvantages of cohort and case–control studies.
The most common measure used in epidemiology is the relative risk (RR), which is the ratio of the rate of a disease in an exposed population to that in the nonexposed population. Figure 4 (after Chen et al., 1991) depicts an association between cholesterol and coronary heart disease for a hypothetical cohort of men. Here, the proposed causal agent (blood cholesterol concentration) is subdivided into four exposure levels for a single endpoint (coronary heart disease).
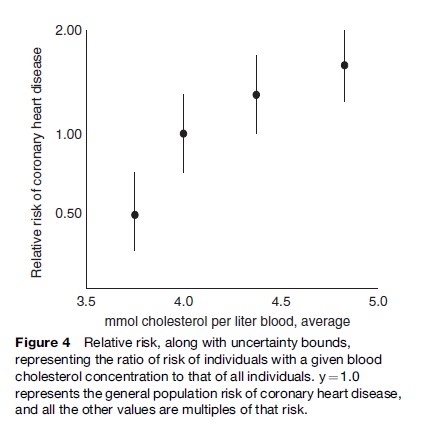
Exposure information from epidemiological studies tends to cover ranges or continua of exposure, rather than the discrete doses found in clinical or toxicological studies. Most often, this is a binary condition: Exposed versus not exposed. Unfortunately, this practice, while typically necessary, limits the ability to make claims about potency.
Uncertainty And Variability In Risk Assessment
The management of uncertainty and variability has been a central issue in risk estimation and decision making over the past decade. A number of sources of uncertainty have been explored above and a number of frameworks have been developed to characterize types and sources of uncertainties. Finkel (1990) separates uncertainty into parameter uncertainty, model uncertainty, and decisionrule uncertainty. In this conceptualization, our understanding of parameters may be limited by the accuracy of measurements and by random and nonrandom errors. Models may be incorrectly conceived, incorrectly specified, or incorrectly computed. Decision-rule uncertainty includes questions about the measure used to describe risk, the statistic or distribution used to characterize the risk, and the appropriateness of various decision rules for comparing risks and assessing acceptability of risks. Of particular concern is when a particular decision preference is conflated with ignorance or irrationality. For example, person A may prefer an expected value decision rule, while person B prefers a rule that avoids worst-case scenarios. If person A expects everyone to agree that the expected value is the appropriate rule, then he may interpret person B’s preference as a lack of knowledge rather than a disagreement about preferences.
Parameter, model, and decision-rule uncertainty are not always independent and may be synergistic. Some objections to expected value decision rules arise from normative, or values-based, disagreement. Other objections may be based on the inability of models (e.g., cost–benefit analysis) to meaningfully differentiate among options.
Variability is often treated along with uncertainty, although there are structural and normative reasons to distinguish between them. Variability is the range of values that a particular characteristic can take. Salient types of variability include susceptibility (that is, variability in the dose–response function from person to person), exposure (for example, consumption of foods or concentrations of contaminants in similar work sites), and behavior (for example, driving competence or sexual activity).
The EPA, FDA, and other agencies have compiled large databases for some important variables, such as consumption of a wide range of foods by individuals by age, gender, ethnicity, and geographic location. Such data allow much more meaningful estimates of risk than simple average or worst-case values. With information on variability, risk can be characterized as a range of outcomes or the fraction of individuals above or below some critical number (Hattis and Anderson, 1999). Susceptibility remains one of the most important and least well-acknowledged sources of variability in risk. EPA handles person-to-person differences in susceptibility to non-cancer health effects by incorporating a safety factor of 10 in the absence of chemical-specific information supporting a different factor. A tenfold adjustment may be insufficient to account for individuals who are particularly sensitive to an exposure, by virtue of genetic factors, concurrent disease status, nutritional status, or other reasons (Hattis et al., 1999). For cancer, EPA implicitly treats all humans (except newborns) as equally susceptible, and therefore fails to adjust appropriately for all individuals who are more (or less) susceptible than average; the 1994 NAS committee referred to this as the most important missing default in EPA’s risk assessment procedures.
Innovations
A number of methods have gained a foothold in risk assessment over the past decade. These include systems modeling, Monte Carlo analysis, Bayesian analysis, and cost-effectiveness analysis. None of these is particularly new, but methodological, computing, and empirical advances, as well as philosophical preferences, have allowed them to become common in current risk assessment practice.
Systems modeling describes interactions and dependencies, rather than more simplistic linear relationships. PBPK models describe how a particular agent enters, is changed by, and exits a physiological system. For example, a model of alcohol in the human brain would include flow of alcohol into the body through the digestive system, alcohol metabolism by various organs, and elimination of alcohol through urine. The fate and transport of a pollutant in an ecosystem can be similarly modeled. A variety of software packages are available for general system dynamics modeling, as are a variety of specialized utilities.
Monte Carlo analysis is a statistical tool used to combine empirical or theoretical distributions through iterated random sampling. For example, consider the risk model that combines inhalation of a chemical and potency of that chemical in eqn [5].
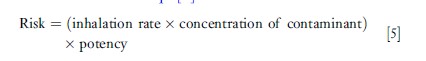
An expected risk calculation could be based on the average values of the three independent variables. However, we might know more about these variables than just the means, and each of these could be described as a distribution. A Monte Carlo analysis would randomly draw from the three distributions, store the result, and repeat the process several thousand times. The output distribution could then be described with standard statistics (e.g., mean, median, mode, deciles, percentiles, variance). Alternatively, the results can be displayed graphically as a probability density function or cumulative distribution function.
Bayesian analysis has been available for several centuries as a tool for combining new and existing information. Bayesian analysis allows one to formally assess the extent to which new information should change expectations about risks. For example, the meaningfulness of a positive test for a rare disease is strongly dependent on specificity (probability of a negative result being a true negative) and the sensitivity (probability of a positive result being a true positive) of that test, and particularly dependent on the prevalence of the disease in the population, a positive result on a very reliable (but not perfect) test for a rare disorder may be more likely to be a false positive than a true positive, given that most of those tested will not in fact have the disease. Bayesian analysis combines the expectation about the disease without the test with the information learned from the test to arrive at a posterior or updated expectation about the disease.
Cost-effectiveness analysis (CEA) has become increasingly salient and controversial, as the U.S. Office of Management and Budget, the World Health Organization, and others have increasingly applied it to a range of risk-related regulations. Common cost-effectiveness metrics include cost per life saved, cost per year of life saved, and cost of saving a quality-adjusted life year (QALY) or disability-adjusted life year (DALY). Critiques of CEA include both ethical and methodological concerns (Hassenzahl, 2006).
Conclusion
Risk assessment is a common tool for assessing and managing environmental and public health decisions. This trend is likely to continue for the foreseeable future, unresolved and sometimes considerable concerns about ethical and technical limitations notwithstanding. Advances, especially in understanding of disease causality and human variability, may improve our ability to generate risk estimates more appropriate to individuals and subpopulations. Controversies about the social appropriateness of risk assessment, and the relative efficacy of epidemiological, toxicological, and theoretical perspectives on risk, are likely to continue to play an important role in risk-based decision making.
Bibliography:
- Baird SJ, Cohen JT, Graham JD, Shlyakhter AI, and Evans JS (1996) Non-cancer risk assessment: Probabilistic characterization of population threshold doses. Regulatory Toxicology and Pharmacology 2(1): 79–102.
- Bernstein PL (1998) Against the Gods: The Remarkable Story of Risk. Hoboken, NJ: J Wiley and Sons.
- Breyer S (1993) Breaking the Vicious Circle: Toward Effective Risk Regulation. Cambridge, MA: Harvard University Press.
- Clewell HJ III, Andersen ME, and Barton HA (2002) A consistent approach for the application of pharmacokinetic modeling in cancer and noncancer risk assessment. Environmental Health Perspectives 110(1): 85–93.
- Covello VT and Merkhofer MW (1993) Risk Assessment Methods: Approaches for Assessing Health and Environmental Risk. New York: Plenum.
- Covello VT and Mumpower J (1985) Risk analysis and risk management: An historical perspective. Risk Analysis 5(2): 103–120.
- Dourson MA, Felter SP, and Robinson D (1996) Evolution of sciencebased uncertainty factors in noncancer risk assessment. Regulatory Toxicology and Pharmacology 24: 108–120.
- Environmental Protection Agency (2007) Glossary of Terms. http:// www.epa.gov/economics/children/basic_info/glossary.htm (accessed November 2007).
- Finkel AM (1989) Is risk assessment really too conservative? Revising the revisionists. Columbia Journal of Environmental Law 14: 427–467.
- Finkel AM (1990) Confronting Uncertainty in Risk Management: A Guide for Decision-Makers. Washington, DC: Resources for the Future.
- Finkel AM (1995) Toward less misleading comparisons of uncertain risks: The Example of aflatoxin and alar. Environmental Health Perspectives 103(4): 376–385.
- Hassenzahl DM (2005) The effect of uncertainty on ‘risk rationalizing’ decisions. Journal of Risk Research 8(2): 119–138.
- Hassenzahl DM (2006) Implications of excessive precision for risk comparisons: Lessons from the past four decades. Risk Analysis 26(1): 265–276.
- Hattis D and Anderson EL (1999) What should be the implications of uncertainty variability, and inherent ‘‘biases’’/‘‘Conservatism’’ for risk management decision-making? Risk Analysis 19(1): 95–107.
- Hattis D, Banati P, and Goble R (1999) Distributions of individual susceptibility among humans for toxic effects: How much protection does the traditional tenfold factor provide for what fraction of which kinds of chemicals and effects? Annals of the New York Academy of Sciences 895: 286–316.
- IARC (2006) IARC Monographs on the Evaluation of Carcinogenic Risks to Humans: Preamble. Lyon, France: Revised January 2006; accessed at http://monographs.iarc.fr/ENG/Preamble/ CurrentPreamble.pdf.
- Kammen DM and Hassenzahl DM (1999) Should We Risk It? Exploring Environmental Health and Technological Problem Solving. Princeton, NJ: Princeton University Press.
- Montague P (1999) The waning days of risk assessment. Rachel’s Environment and Health News #652.May 29, 1999.
- National Research Council (1983) Risk Assessment in the Federal Government: Managing the Process. Washington, DC: National Academy Press.
- National Research Council (1994) Science and Judgment in Risk Assessment. Washington, DC: National Academy Press.
- National Research Council (1996) Understanding Risk. Washington, DC: National Academy Press.
- Nichols AL and Zeckhauser RJ (1986) The perils of prudence: ‘‘How conservative risk assessments distort regulation,’’ Regulation Nov/Dec: 13–24.
- Peto R, Gray R, Brantom P, and Grasso P (1991) Effects on 4,080 rats of chronic ingestion of N-nitrosodiethylamine or N-nitrosodimethylamine: A detailed dose-response study. Cancer Research 51: 6415–6419.
- Rhomberg LR (2004) Mechanistic considerations in the harmonization of dose-response methodology: The role of redundancy at different levels of biological organization. In: McDaniels T and Small M (eds.) Risk Analysis and Society: An Interdisciplinary Characterization of the Field, pp. 46–73. Cambridge, UK: Cambridge University Press.
- Ruckelshaus WD (1984) Risk in a Free Society. Risk Analysis 4(3): 157–162.
- Stone R (2005) Russian Cancer Study adds to the indictment of low-dose radiation. Science 310: 959.
- Byrd DM and Cothern CR (2001) Introduction to Risk Analysis: A Systematic Approach to Science-Based Decision Making. Rockville, MD: ABS Group.
- Cox LA (2002) Risk Analysis: Foundations Models and Methods. Norwell, MA: Kluwer.
- Ezzati M, Lopez AD, Rodgers A, and Murray CJL (eds.) (2005) Comparative Quantification of Health Risks. Geneva, Switzerland: World Health Organization.
- Haimes YY (1998) Risk Modeling Assessment and Management. New York: Wiley and Sons.
- Morgan MG and Henrion M (1990) Uncertainty: A Guide to Dealing with Uncertainty in Quantitative Risk and Policy Analysis. Cambridge, UK: Cambridge University Press.
- National Research Council (1993) Issues in Risk Assessment. Washington, DC: National Academy Press.
- Paustenbach DJ (ed.) (2002) Human and Ecological Risk Assessment: Theory and Practice. Hoboken, NJ: Wiley Interscience.
See also:
Free research papers are not written to satisfy your specific instructions. You can use our professional writing services to buy a custom research paper on any topic and get your high quality paper at affordable price.
ORDER HIGH QUALITY CUSTOM PAPER

Always on-time

Plagiarism-Free

100% Confidentiality


