
This sample Outdoor Air Pollution Research Paper is published for educational and informational purposes only. If you need help writing your assignment, please use our research paper writing service and buy a paper on any topic at affordable price. Also check our tips on how to write a research paper, see the lists of health research paper topics, and browse research paper examples.
Air pollution presents a difficult worldwide public health challenge because it is so widespread and is emitted by so many different types of sources. This pollution includes both gaseous and particle pollutants. These pollutants can originate as primary pollutants (those exhausted directly into the air by pollution sources) or as secondary pollutants (those formed in the atmosphere, largely from the primary pollutants). The primary pollutants include particulate matter (PM), which includes carbonaceous black soot, and gaseous pollutants, which include: sulfur oxides (such as sulfur dioxide, SO2), nitrogen oxides (such as nitric oxide, NO, and nitrogen dioxide, NO2), and carbon oxides (such as carbon monoxide, CO, and carbon dioxide, CO2). Secondary air pollutants include gaseous ozone (a major component of photochemical smog) formed from nitrogen oxides and hydrocarbons, and particulate sulfate (e.g., sulfuric acid) and nitrate (e.g., ammonium nitrate) aerosols created in the atmosphere from sulfur and nitrogen oxide gases, respectively. Combustion and secondary particles are usually very small, too small to see individually with the human eye, and are usually less than 1 micrometer (mm) in diameter. By comparison, a human hair is roughly 70 mm in diameter. Such tiny particles are especially of health concern because they tend to be more enriched in toxic compounds, and because they can also penetrate deeper into the lung than the larger PM generated by natural processes (such as windblown soil particles).
Although outdoor air pollution first caught the world’s attention as a health threat because of major pollution disasters, such as the London Smog episode in 1950 that resulted in thousands of excess deaths (Ministry of Health of Great Britain, 1954), indoor air pollution has also now been increasingly recognized as also providing air pollution exposure risks, especially in the developing world. The most striking example of this fact is the recent World Health Organization (WHO) report citing indoor air pollution from biofuels used for heating and cooking as one of the largest environmental health risks facing the world, with about 1.5 million deaths annually attributed to the combustion particles created by indoor fires or stoves (WHO, 2002).
This research paper discusses each of the major outdoor air pollutants, how these air pollutants are dispersed in the environment, and what human health effects have been associated with either short-term or long-term exposures to these air pollutants. The focus of the paper is on outdoor air pollution, and primarily human-derived anthropogenic emissions of this air pollution (e.g., from fossil fuel combustion), rather than those from natural causes (e.g., pollens).
Sources Of Air Pollution
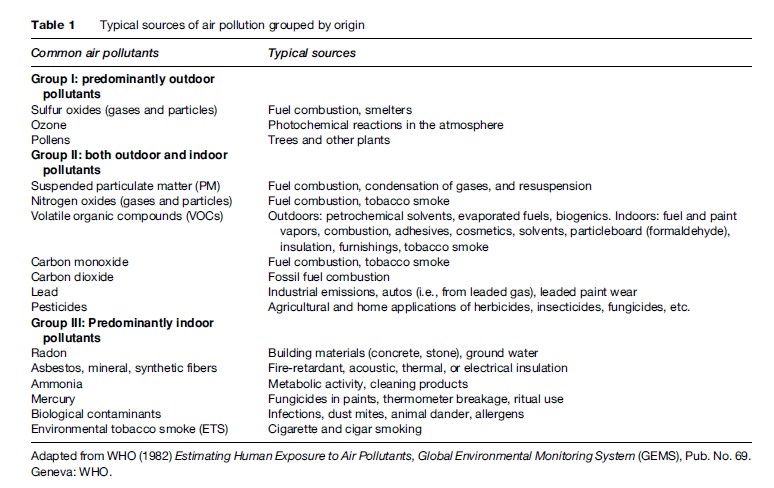
Air pollutants are emitted and formed both outdoors and indoors, resulting in personal pollutant exposures that can greatly exceed levels measured by routine air measurements made at central-site ambient outdoor air monitoring stations. Pollutants can be usefully categorized into three classes: (1) pollutants primarily emitted into the outdoor environment, (2) pollutants primarily emitted into the indoor environment, and, (3) pollutants emitted into both outdoor and indoor environments, as summarized in Table 1. The primarily outdoor air pollutants, and their typical sources, are discussed in greater detail in this research paper.
Sulfur Oxides
Sulfur oxides are present in the ambient air primarily as primary gaseous SO2 or secondary particulate sulfate(SO42-). SO2 is formed when fossil fuels containing sulfur (mainly coal or oil) are burned, and by metal smelting and other industrial processes. The highest monitored concentrations of SO2 are usually recorded in the vicinity of large industrial facilities lacking modern emission controls, such as older coal-fired power plants. In the United States, fuel combustion accounts for most of the total SO2 emissions (U.S. EPA, 2000a). Over 65% of SO2 released to the air in the United States comes from electric utilities, primarily from units that burn coal. Other sources of SO2 are industrial facilities that derive their products from raw materials like metallic ore, coal, and crude oil, or that burn coal or oil to produce process heat. Examples include petroleum refineries, cement manufacturing, and metal processing facilities. Also, locomotives, large ships docked at deep ports (which often burn especially polluting ‘bunker’ fuel), and some non-road diesel equipment still burn high sulfur fuel and release SO2 emissions to the air in large quantities. Natural sources of SO2 include releases from volcanoes, biological decay, and forest fires.
SO2 is also a major source of secondary PM air pollution. Once emitted into the air, SO2 can dissolve in water vapor to form acidic aerosols (by heterogeneous formation), and can also interact with other gases and particles in the air to form sulfates and other PM products via homogeneous formation. These sulfate particles can be harmful to humans and to their environment, including via acid rain. Secondary fine particle sulfates formed in the atmosphere from SO2 unfortunately also have a typical diameter roughly equal to that of the optimum visible wavelength of sunlight (0.5 mm), so they can also cause significant visibility impairment via the scattering of light, most noticeably as a milky white haze during afternoons in the summer months. In addition, their small size allows these sulfates to be transported over long distances, far from the point of original SO2 emission. Thus, air pollution problems resulting from sulfur oxide emissions are not limited to the localities where these pollutants are first emitted.
Ozone
Ozone (O3) is a secondary gas that is not usually emitted directly into the air, but is instead created in the atmosphere by a chemical reaction between oxides of nitrogen (NOx) and volatile organic compounds (VOCs) in the presence of sunlight. Ozone has the same chemical structure whether it occurs miles above the earth or at ground level and can be deemed ‘good’ or ‘bad,’ depending on its location in the atmosphere. ‘Good’ ozone forms naturally in the stratosphere, approximately 20 miles above the Earth’s surface, forming a protective layer around the globe that absorbs the sun’s most harmful ultraviolet rays. At the surface, however, the presence of ozone is largely not natural, and can result in adverse human health effects when breathed.
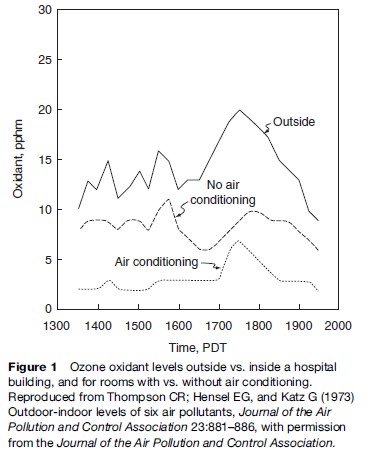
Motor vehicle exhaust, industrial emissions, gasoline vapors, and chemical solvents, as well as some natural sources (such as vegetative matter), emit VOCs into the atmosphere, which can then react with NOx via a complex series of atmospheric reactions to form O3 in the presence of warmth and sunlight. Many urban areas therefore have high levels of ozone during the warmer months (with more hours of sunlight), but even rural areas are also exposed to increased summertime ozone levels because winds can carry ozone (and the precursor pollutants that form it) hundreds of miles away from their original source locale. As a result, O3 is usually a summertime air pollutant, with concentrations commonly peaking in the late afternoon, as shown in Figure 1. As also shown in Figure 1, levels of ozone diminish indoors, as it is primarily formed outdoors, and upon entering a building quickly reacts with the interior walls and furnishings and is removed from the air, especially when air conditioning is present in the building.
Particulate Matter
Particulate matter (PM) represents a broad class of chemically and physically diverse aerosols composed of solid particles or liquid droplets suspended in the air. Such aerosols can be characterized by their size, formation mechanism, origin, chemical composition, atmospheric behavior, and method of measurement. PM air pollution can be viewed in two major components: primary PM, or soot, emitted directly into the atmosphere by pollution sources such as industry, electric power plants, diesel buses, and automobiles, and secondary PM, formed in the atmosphere from primary gaseous pollutants, such as sulfur dioxide and nitrogen oxide gases. The concentration of particles in the air varies across space and time and is related to the source of the particles and the pollutant transformations that occur in the atmosphere. In many parts of the developing world, cooking and heating are done by using wood, crop waste, or dried animal dung as fuel (e.g., see Smith et al., 2004), causing even greater exposures to PM, both outdoors and indoors.
PM air pollution is commonly characterized as particles that fit the following general size fractions:
- PM10 (defined as all particles equal to and less than 10 micrometers (mm) in aerodynamic diameter). Particles larger than this are not generally able to be breathed past the trachea, and are caught in the nose and throat, not depositing in the lung.
- PM10–2.5, also known as coarse fraction particles (defined as those particles with an aerodynamic diameter greater than 2.5 mm, but equal to or less than a 10 mm in diameter).
- 5, also known as fine fraction particles (generally defined as those particles with an aerodynamic diameter of 2.5 mm or less), can be breathed into the deepest recess of the lung.
- Ultrafine particles, generally defined as those less than 0.1 mm in diameter. Some scientists have hypothesized that ultrafine particles, because of their small size and large surface area to mass ratio, may be especially toxic.
Fine and coarse particles differ in terms of the emission sources, formation processes, chemical composition, atmospheric residence times, transport distances, and other parameters. Fine particles are directly emitted from combustion sources, and are also formed secondarily from gaseous precursors such as sulfur dioxide, nitrogen oxides, or organic compounds. During the summer months, these secondary particles often dominate the PM2.5 mass. Such fine particles are commonly composed of sulfate, nitrate, chloride, and ammonium compounds, organic and elemental carbon, and metals. Combustion of coal, oil, diesel, gasoline, and wood, as well as industrial process sources (such as smelters and steel mills), can produce emissions that contribute to ambient fine particle concentrations. Fine particles can remain in the atmosphere for days to weeks and travel through the atmosphere hundreds to thousands of kilometers, whereas most coarse particles typically deposit to the Earth within minutes to hours and within tens of kilometers from the emission source.
Coarse particles are typically mechanically generated outdoors by crushing or grinding operations, but atmospheric concentrations are often dominated by dusts and crustal material resuspended by traffic on paved or unpaved roads. Other outdoor sources of coarse particles include those from construction, farming, and mining activities.
Nitrogen Oxides
Nitrogen oxide (NOx) pollution is formed whenever fuel is combusted at high temperatures by a ‘fixing’ of the nitrogen in the combustion chamber’s dilution air into NOx. Many of the nitrogen oxides are colorless and odorless. However, one common NOx, nitrogen dioxide (NO2), along with particles in the air, can often be seen as a reddish-brown layer in the air over urban areas. NOx is one of the main ingredients involved in the formation of ground-level ozone, which can trigger serious respiratory problems. It also reacts to form nitrate particles and acidic aerosols, contributing to the formation of acid rain. Particulate nitrates resulting from NOx contribute to fine atmospheric particles that can cause visibility impairment. NOx gases also contribute to the global warming problem.
The major outdoor sources of NOx are primarily emissions from transportation (virtually all of which are from motor vehicles) and fuel combustion. In the United States, transportation emissions account for over half of all NOx emissions. The other half of U.S. outdoor NOx emissions is largely a result of fuel combustion emissions, which are roughly evenly split between electric utilities (at 22%) and all other industrial, commercial, and residential combustion (at 20%) (U.S. EPA, 2000b). Natural processes can also form NOx, including volcanoes, oceans, biological decay, and lightning strikes. Indoor sources of NOx include kerosene heaters, unvented gas stoves and heaters, and cigarette smoking.
Volatile Organic Compounds
Volatile organic compounds (VOCs) are organic chemicals that readily produce vapors at ambient temperatures, and are therefore emitted as gases from certain solids or liquids. All organic compounds contain carbon, and organic chemicals are the basic chemicals found in all living things. Many organic compounds in our air today do not occur naturally but are instead man-made, formed during industrial processes or combustion. VOCs include a variety of chemicals, some of which may have short and long-term adverse health effects. Sources of VOCs include gasoline, industrial chemicals such as benzene, solvents such as toluene and xylene, and perchloroethylene (principal dry cleaning solvent). VOCs are also released from burning fuel, such as gasoline, wood, coal, natural gas, and from solvents, paints, glues, and other products used at home or work. Many VOCs are also classified by the U.S. EPA as ‘air toxics.’ Toxic air pollutants are defined as those pollutants that cause or may cause cancer or other serious health effects, such as reproductive effects or birth defects. In the United States, industrial processes (at 47%) and vehicle emissions (at 44%) are the dominant sources of outdoor VOCs (U.S. EPA, 2000b).
Carbon Monoxide
Carbon monoxide, or CO, is a colorless, odorless gas formed when carbon in fuel is not completely combusted. CO is toxic to humans because it very effectively competes with oxygen in the blood for binding sites with the heme portion of blood cells, reducing the ability of the blood to carry oxygen to various parts of the body, including the heart and brain. When breathed at acutely high levels, CO can be fatal, and indoor exposures to fire pollution and emissions from faulty appliances indoors causes thousands of deaths per year in the United States (Kleinman, 2000).
CO is a component of motor vehicle exhaust, which contributes most of the emission of outdoor CO. In the United States, a total of about 56% of all outdoor CO emissions nationwide result from on-road vehicles (U.S. EPA, 2000b). Off-road engines and vehicles (such as construction equipment and boats) contribute another 22% of all CO emissions nationwide, or nearly one-third of all vehicular emissions of CO. Thus, higher levels of CO generally occur in areas with heavy traffic congestion, such as near entrances to tunnels. In cities, nearly all CO emissions may come from motor vehicle exhaust. Other outdoor sources of CO emissions include industrial processes (such as metals processing and chemical manufacturing), residential wood burning, and natural sources such as forest fires. Woodstoves, gas stoves, cigarette smoke, and unvented gas and kerosene space heaters are sources of CO indoors. The highest levels of CO in the outside air typically occur during the colder months of the year, when, as is discussed in the next section, atmospheric inversion conditions are more frequent, thus leading to higher localized pollution levels.
Carbon Dioxide
Carbon dioxide (CO2) is emitted as a result of fossil fuel combustion (e.g., burning of coal, oil, and natural gas). At high concentrations, CO2 can also have direct human health effects and can cause burns, frostbite, and blindness if an area is exposed to it in solid or liquid form. If inhaled, it can be toxic in high concentrations, causing an increase in breathing rate, unconsciousness, and death. But its greatest importance is as a component of the Earth’s atmosphere. CO2 is only a minor constituent of natural air (about 0.03%), but the increased use of fossil fuels is increasing the amount of carbon dioxide in the atmosphere. This is a problem because CO2 is a principal ‘greenhouse effect’ gas. The greenhouse effect is the heating of the Earth due to the presence of gases in the atmosphere that cause an effect similar to that produced by the glass panes of a greenhouse: shorter-wavelength solar radiation from the sun passes through Earth’s atmosphere, but when part of the energy absorbed by the Earth is then reradiated back to the atmosphere as long-wave infra-red radiation, the greenhouse gases capture the long wave infrared light, causing the lower atmosphere to warm. This ‘greenhouse gas’ process is a natural one that has been happening on Earth for millions of years but is now being greatly increased by human emissions of greenhouse gases such as CO2.
Lead
The major sources of atmospheric lead (Pb) emissions have historically been motor vehicles (such as cars and trucks) and industrial sources. However, leaded gasoline was phased out of use in the United States during the mid-1970s through mid 1980s, and in Europe during the 1990s. Since the phase-out of leaded gasoline in the United States, metals processing has become the major source of lead emissions to the outdoor air, representing some 52% of all emissions in the United States, with all industrial processes accounting for some 74% of Pb emissions (U.S. EPA, 2000b). Virtually all remaining transportation emissions of Pb in the United States are now by off-road vehicles. Other stationary sources of lead include waste incinerators and disposal (accounting for some 16% of the total), utilities, and lead-acid battery manufacturers (U.S. EPA, 2000b). In certain countries of the developing world, lead has yet to be phased out of all gasoline, so automotive emissions remain a significant concern in those countries. Progress continues on controlling lead in the environment, however, and, as of the end of 2005, the sub-Saharan nations of Africa phased out use of leaded gasoline in automobiles (Washington Post , 2006).
Air Pollution Dispersion In The Atmosphere
Air pollutants emitted into an indoor or outdoor environment will spread out and disperse throughout the environment into which they are released. Since the human species learned to use fire for warmth and cooking, the atmosphere has been relied upon to carry away the pollution caused by these human activities. However, since the start of the Industrial Revolution in the last part of the eighteenth century, the capacity of our environment to dilute and carry away these pollutants has been put under greater and greater strain, to the point where the pollution from any one city, state, or nation is of growing health concern to others.
Modeling The Dispersion Of Air Pollution
The rate and way in which contaminants disperse are major determinants as to who will be most affected by the pollutants and for how long. Historically, a commonly heard phrase concerning air pollution was: ‘‘The solution to pollution is dilution.’’ This philosophy is mathematically embodied by the ‘box model’ of air pollution, which is:
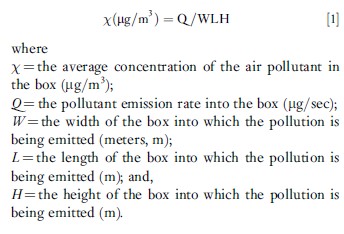
This model assumes, of course, that the pollution is well mixed in the box being considered. For the case of a city as the ‘box,’ the Q is all the pollution emitted by the city in a given time period (e.g., tons per hour), the ‘box’ width is the width of the urban area, and the ‘box’ height, H, is the height to which the pollution is mixed (which is the height of the mixing layer in the atmosphere, commonly about 1 kilometer high). The value for a city’s ‘box’ L is dependent upon the wind speed, u, with the greater the wind speed increasing L and decreasing the average concentration, w, of the air pollutant in question. Simply put, this box model says that the more pollution emitted (Q), the higher the pollution concentration in the air, for a given dilution box size, and, conversely, the bigger the dilution box (i.e., the larger the W, L, or H), the lower the pollution concentration in the air resulting from a given Q emission rate.
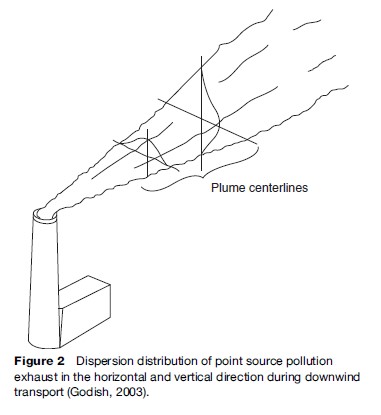
This very simple box model is actually the basis for all air pollution models, but with many refinements. These modeling refinements often include the use of many small boxes for one urban area and the addition of wind trajectories (allowing the wind directions to change over time as the pollution travels). Another important refinement to dispersion models of individual sources is that the pollution disperses, not into a well-mixed ‘box’ of air, but instead it spreads in a distribution called the ‘normal’ or ‘Gaussian’ distribution such that the highest concentration is directly downwind, as shown in Figure 2. The bell-shaped normal distribution of the pollutants in the vertical and horizontal directions, as shown in Figure 2, is not constant over time, but increases when the amount of turbulence in the air increases. Generally, more turbulence (and wider bell-shaped distributions of the plume) occurs on sunny days versus cloudy days or at night (both of which have far less solar heating-induced turbulence).
Atmospheric Effects On The Dispersion Of Air Pollution
Other factors that can affect the dispersion of air pollutants in the atmosphere include topographical (terrain) influences and the presence (or lack) of atmospheric inversions, which inhibit the spread of pollution by placing a ‘lid’ on the vertical extent of mixing (i.e., the height of the mixing ‘box’). During intense inversions, the air above is warmer than the air below it, thus inhibiting any upward motion of the colder air, which tends to then sink back down and stay below the lid. One extreme example of these two influences is shown in Figure 3, in which the pollution is released in a valley that has an inversion lid holding the pollution down.
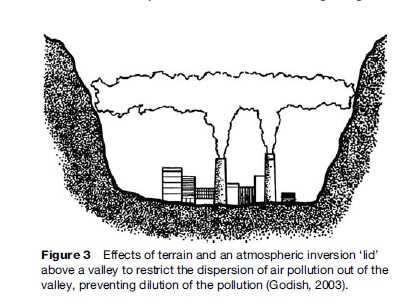
Figure 3 displays exactly the situation that occurred in some of the most famous air pollution disasters in history when pollution captured in valleys built up to lethal levels. One of these was in the Meuse Valley, Belgium during December 1–5, 1930, when high levels of sulfur oxide pollution were associated with more than 60 excess deaths in a matter of days. Another was in the Donora Valley in Pennsylvania, in which there were thousands of excess illnesses and 20 excess deaths during October 26–31, 1948. Such episodes tend to occur in the fall and wintertime of the year, when the surface cooling at night is more conducive to setting up the adverse atmospheric inversion conditions.

Today, as the pollution emitted by mankind increases, the long-range transport of pollution is a larger and larger problem. This transport of pollution was recently made very apparent by a dust storm in the Gobi Desert that caused so much particle air pollution that it was easily tracked half-way around the globe. As shown in Figure 4, the dust storm occurred in Asia at the start of June 2001 and ended up reaching the east coast of the United States by the latter part of that same month.
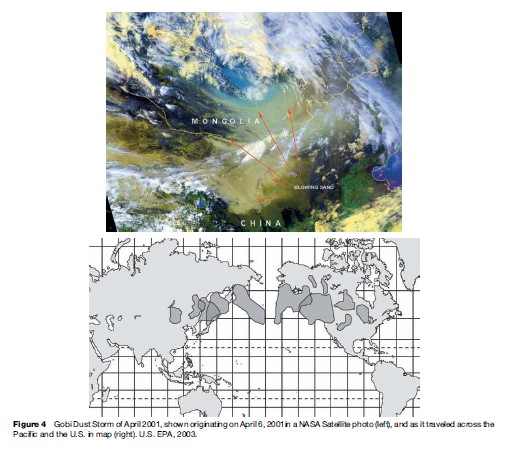
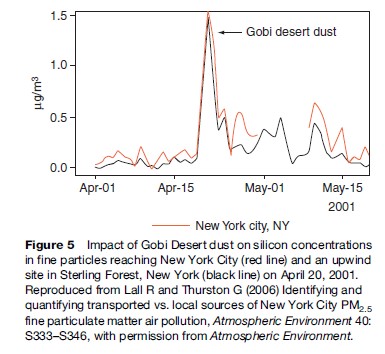
Figure 5 shows the increases in silicon, an element that is highly enriched in soil, that occurred at a site in the middle of New York City and at a site in Sterling Forest, New York, just west and upwind of the city during the Gobi Desert dust episode of 2001. This episode was very discernable because of its magnitude and uniqueness in elemental character, but it makes clear that, in general, pollution emitted in one part of the globe can have large impacts in many other places far downwind of its origin.
Human Health Effects Of Ambient Air Pollution
Entry Of Air Pollutants Into The Body
The respiratory tract is the primary entry portal for airborne contaminants. It comprises three zones: (1) the upper respiratory tract (including the nose and throat airways), (2) the bronchiole airways of the upper lung, through which air is breathed, and (3) the alveolar region, where oxygen exchange between the lung and the circulatory system (bloodstream) occurs across a very thin layer of cells between the air in the lung and the blood in the bloodstream. Where and to what extent a particular air pollutant affects the lung is dependent upon whether it is a gas or a particle, as well as its water solubility or (in the case of particles) its composition and size.
Particles that are inhaled and then not exhaled are deposited in the lung. Larger particles tend to be deposited in the upper respiratory tract or the bronchiole airways. Particles larger than approximately 10 mm in diameter get caught by the nose and throat such that they do not get into the lung, but are instead swallowed or sneezed out of the body. For comparison, a human hair is approximately 70 mm in diameter. Particles less than 10 mm in diameter but more than about 2.5 mm in diameter are largely deposited in the upper airways of the lung, where the insoluble particles are rapidly cleared out of the lung by the tiny hair-like cilia that line these airways, being carried up the lining of the lung to the throat, where they are swallowed and cleared from the body by the digestive tract. The fine particles (those less than approximately 2.5 mm in diameter) more readily reach the deepest recesses of the lung, where they can be deposited in the sensitive alveolar region, and are also not as rapidly cleared as from the upper airways and therefore can cause significant damage.
The extent to which gaseous air pollutants reach deep into the lung is defined largely by the solubility of the gas. Sulfur dioxide, for example is highly soluble in water, and so it is readily absorbed by the mucous lining of the nose, throat, and upper airways and does not usually reach the alveoli in the deepest parts of the lung. In contrast, less water-soluble gases, such as NO2, are not as readily absorbed in the upper airways and are more likely to reach the alveoli and have the potential to do damage there.
In recent years, interactions of particles and gases have been found to modify the toxicities of each other. For example, if SO2 is present along with particles, it can be absorbed onto and react with the surface of the particle, convert into sulfur oxides such as sulfuric acid (H2SO2–) or ammonium bisulfate (NH3HSO4), and thereby bypass the defenses of the lung and reach the deepest parts of the lung. Conversely, the addition of sulfur oxides to a particle can cause that particle to become more acidic, thereby increasing the solubility of the metals in the particle such that, upon impaction on the lung, these metals can be more bio-available, thereby getting into the body before it can be cleared. In the case of transition metals (such as vanadium and iron), for example, this can cause these metals to cause greater oxidative stress in the body than they would without the co-presence of sulfur oxides on the particle (e.g., see Costa and Dreher, 1997).
Air Pollutant Health Effects
Background
The earliest convincing evidence that very serious health consequences can result from exposures to air pollution comes from historical pollution episodes, notably the Meuse Valley and the Donora disasters discussed previously, and the London fog episodes of the 1950s and 1960s. A landmark event in the recognition of the disastrous impacts of air pollution on health occurred on December 1–5, 1952 in London. Trapped coal smoke in the River Thames valley accumulated as a result of a stationary high-pressure cell accompanied by wind speeds near zero. Approximately 4000 excess deaths occurred in London that week, and excess deaths continued for weeks afterward, thus indicating that there were both immediate and delayed effects.
More recently, there were regional air pollution episodes of particulate matter from massive forest fires in Southeast Asia and Mexico in the 1990s, shutting down businesses, schools, and airports. As recently as 1998, schools in Tehran, Iran were shut down because automobile exhaust made O3 air pollution levels rise to six times above acceptable levels, causing some residents to wear masks when venturing outdoors. Thus, pollution episodes can still occur today, especially in rapidly developing nations.
Epidemiological Studies Of The Health Effects Of Present-Day Air Pollution
Although subsequent studies linking more routine levels of air pollution and adverse health outcomes are not as obvious, recent epidemiological studies have found statistically significant associations between multiple individual pollutants and a wide range of significant adverse and preventable health effects at present-day pollutant levels in the United States, and sometimes even in areas with pollution levels below current air pollution standards. The acute adverse health effects of air pollution have been shown to include reduced lung function, inflammation in the lung, increased numbers of asthma attacks, excess respiratory and cardiac hospital admissions, and even premature death. The documentation of the adverse effects of chronic exposure to air pollution is not as extensive as for acute effects, but it has been reported to cause the induction of respiratory diseases such as bronchitis and asthma, as well as to cause premature mortality.
As a result of a growing body of epidemiological and toxicological studies, the air pollution association with adverse health effects seen in past episodes has been confirmed and better understood to also occur at much lower present-day air pollution levels. Indeed, in the early days of air pollution epidemiology and regulation, it was believed that there was a ‘threshold’ level of pollution below which no effects would be found, but as levels in the ambient air have declined, scientists have yet to find a level of air pollution below which no adverse effects are found. This indicates that increases in air pollution can be expected to proportionally increase the risk of adverse health effects of air pollution among exposed populations.
Particulate matter (PM) and ozone (O3) are among the key air pollutants that have been revealed by research to adversely affect human health. As discussed next, the health effects that have been associated with exposure to ambient PM and ozone include a range of morbidity (illness) and mortality (death) effects from both acute and chronic exposure.
Health Effects Of Acute PM Air Pollution Exposures
Acute (short-term) increases in air pollution have been found to be associated with increases in the number of daily asthma attacks, hospital admissions, and mortality. In particular, it has been found that PM air pollution is associated with increased risk of respiratory hospital admissions (relative risk (RR) >1.0) in New York City and Buffalo, New York, and Toronto, Ontario, as well as with mortality in cities such as Chicago, Illinois, and Los Angeles, California (see, e.g., Thurston et al., 1992). These results have been confirmed by other researchers considering locales elsewhere in the United States, and in other cities throughout the world (e.g., see Schwartz, 1997; U.S. EPA, 2004).
In addition to lung damage, recent epidemiological and toxicological studies of PM air pollution have shown adverse effects on the heart, including an increased risk of heart attacks. For example, when PM stresses the lung (e.g., by inducing edema), it places extra burden on the heart, which can induce fatal complications for persons with cardiac problems. Indeed, Peters et al. (2001) found that elevated concentrations of fine particles in the air could elevate the risk of myocardial infarctions (MIs) within a few hours, and extending 1 day after PM exposure. These researchers found that a 48% increase in the risk of MI was associated with an increase of 25 μg/m3 PM2.5 during a 2-h period before the onset of MI, and a 69% increase in risk to be related to an increase of 20 μg/m3 PM2.5 in the 24-h average 1 day before the MI onset (Peters et al., 2001).
Studies from individual cities around the United States and the world have also indicated increased risk of death (RR >1.0) on high PM pollution days in other nations, as well (e.g., see Schwartz, 1997). Epidemiologic research conducted on U.S. residents has also indicated that acute exposure to PM air pollution is associated with increased risk of mortality. A recent nationwide time-series statistical analysis of mortality and PM10 air pollution in 90 cities across the United States indicates that, for each increase of 10 μg/m3 in daily PM10 air pollution concentration, there is an associated increase of approximately 0.3% in the daily risk of death (Health Effects Institute, 2003). Although a 0.3% change in the daily death risk may seem small, it is important to realize that such added risks apply to the entire population, and accumulate day after day, week after week, and month after month, until they account for thousands of needless daily deaths from air pollution in the United States each year. Whereas most past studies investigate the acute effects of the PM mass on human health effects, newer studies are starting to evaluate the mortality impacts of PM by source-specific components (e.g., see Thurston et al., 2005), raising the prospect that we may someday be able to differentiate the relative roles of various pollution sources in the human health effects of PM air pollution.
Effects Of Long-Term Exposure To PM
In addition to the acute health effects associated with daily PM pollution, long-term exposure to fine particles is also associated with increased lifetime risk of death, and has been estimated to take years from the life expectancy of people living in the most polluted cities, relative to those living in cleaner cities. The first studies to show this association were cross-sectional studies that compared metropolitan area death rates in high and low-PM cities, after adjusting for potentially confounding factors in the populations, such as age, sex, and race (e.g., Ozkaynak and Thurston, 1987). These results have since been confirmed by cohort studies that followed large groups of individuals in various cities over time that are able to control for potential confounding factors on an individual level. For example, in the Six-Cities Study (which was a key basis for the setting of the original PM2.5 annual standard in 1997), Dockery et al. (1993) analyzed survival probabilities among 8111 adults living in six cities in the central and eastern portions of the United States during the 1970s and 1980s. The cities were Portage, Wisconsin (P); Topeka, Kansas (T); a section of St. Louis, Missouri (L); Steubenville, Ohio (S); Watertown, Massachusetts (M); and Kingston-Harriman, Tennessee (K). Air quality was averaged over the period of study in order to study long-term (chronic) effects. It was found that the long-term risk of death, relative to the cleanest city, increased with fine particle exposure, even after correcting for potentially confounding factors such as age, sex, race, smoking, and so forth.
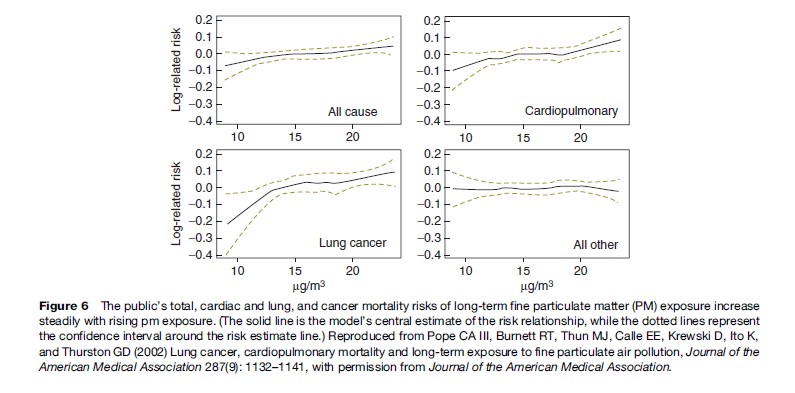
More recently, a study published in the Journal of the American Medical Association shows that long-term exposure to combustion-related fine particulate air pollution is an important environmental risk factor for cardiopulmonary and lung cancer mortality (see Figure 6). Indeed, this study indicates that the increase in risk of lung cancer from long-term exposure to PM2.5 in a city such as New York was of roughly the same size as the increase in lung cancer risk of a non-smoker who breathes passive smoke while living with a smoker, or about a 20% increase in lung cancer risk (see Pope et al., 2002).
Respiratory Health Effects Of O3
Ozone can irritate the human respiratory system, causing exposed people to cough, feel an irritation in the throat, and/or experience an uncomfortable sensation in the chest area. Ozone has also been shown to reduce the lung’s ability to inhale and exhale, thereby making it more difficult for people to breathe as deeply and vigorously as they normally would (e.g., see Bates, 1995). Research shows that ozone can also acutely aggravate asthma, and new evidence suggests that it may cause more children to get asthma. When ozone levels are high, people with asthma have more attacks that require a doctor’s attention or the use of additional medication. One reason this happens is that ozone makes people more sensitive to allergens, which are the most common triggers for asthma attacks. Ozone can inflame and damage cells that line the air passages of the human lung, and O3 has been compared by some to ‘‘getting a sunburn on your lungs.’’ Ozone may also aggravate chronic lung diseases, such as emphysema and bronchitis, and can reduce the immune system’s ability to fight off bacterial infections in the respiratory system. The nature, sources, and health effects of O3 air pollution have been comprehensively summarized in the U.S. EPA’s ozone criteria document (U.S. EPA, 2006).
Health effects of acute O3 exposures
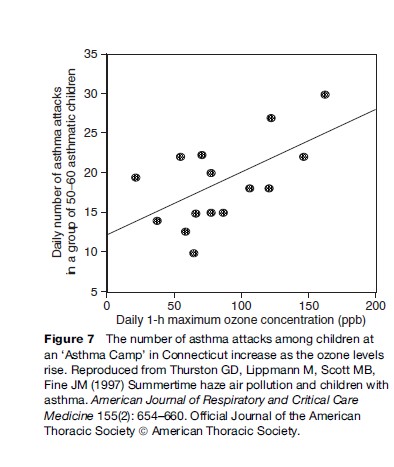
Among the important acute adverse effects associated with ozone exposure to asthmatics is the triggering of asthma attacks. The effects of ozone air pollution on children with asthma have been demonstrated in my own research following a group of children at an asthma summer camp located in Connecticut. This study of a group of about 55 moderate to severely asthmatic children showed that these children experienced statistically significant reductions in lung function, increases in asthma symptoms, and increases in the use of unscheduled asthma medications as ozone pollution levels rose. As shown in Figure 7, the risk of a child having an asthma attack was found to be approximately 40% higher on the highest ozone days than on an average study day (Thurston et al., 1997). Consistent with other research in this area, there is no indication in this plot of a threshold concentration below which children with asthma are safe from the effects of ozone increases.
These asthma camp results have more recently been confirmed by a larger study published in the Journal of the American Medical Association. Gent et al. (2003) presented a cohort study of asthmatic children from the New Haven, Connecticut area, including 130 children who used maintenance medications for asthma and 141 children who did not. The more severe asthmatics were identified as those using maintenance medication. For these severe asthmatics, the study found that the level of O3 exposure was significantly associated with worsening of symptoms and an increase in the use of rescue medication. Each 50 parts per billion (ppb) increase in 1-h average O3 was associated with an increased likelihood of wheezing (by 35%) and chest tightness (by 47%). The findings indicate that asthmatic children are particularly vulnerable to ozone, even at pollution levels below the then existing U.S. EPA air quality standards.
Acute ozone exposure has also been shown to have adverse effects on athletic performance. Epidemiological evidence compiled more than three decades ago suggested that the percentage of high school track team members failing to improve performance increased with increasing oxidant concentrations the hour before a race (Wayne et al., 1967). Controlled exposure studies confirm this association. For example, Schlegle and Adams (1986) exposed 10 young male adult endurance athletes to 120, 180, and 240 ppb O3 while they exercised for 60 minutes. Although all 10 completed the protocol for filtered (clean) air exposure, 1, 5, and 7 of them could not complete it for the 120, 180, and 240 ppb O3 exposures, respectively, indicating that higher O3 concentrations made exercising more difficult.
Epidemiological evidence has accumulated over recent years indicating a role of O3 in daily hospital admissions. Time-series studies conducted in the United States have shown increased risk of hospital admissions (RR >1.0) at higher O3 levels, even after accounting for the effects of PM (Schwartz, 1997). This work has now been expanded to consider 36 cities across the United States, finding that, during the warm season of the year, the 2-day cumulative effect of a 5-ppb increase in O3 was an estimated 0.3% increase in the risk of chronic obstructive pulmonary disease admissions, and a 0.4% increase in the risk of pneumonia admissions (Medina-Ramon et al., 2006).
Epidemiological evidence has also accumulated over recent years indicating a role by O3 in daily human mortality. Time-series studies conducted in cities around the world have shown increased mortality (RR >1.0) at higher ozone concentrations, even after accounting for the mortality effects of PM (Thurston and Ito, 2001). More recently, several new multicity analyses have confirmed the ozone–mortality relationship. These include meta-analyses of multiple past ozone studies that show consistent associations between ozone and increases in mortality (Bell et al., 2004; Ito et al., 2005; Levy et al 2005). In one recent new analysis of some 95 U.S. cities over two decades published in the Journal of the American Medical Association, Bell et al. (2004) showed that, even after controlling for PM and weather, an increase of 10 ppb in daily ozone pollution was associated with approximately a 0.5% increase in daily risk of death. As discussed earlier, this percentage increase in daily admissions, though small, affects a huge portion of the population and accumulates day after day to the point that it accounts for thousands of deaths each year in the United States.
Health Effects Of Long-Term Ozone Exposure
Ozone may also cause permanent lung damage. Repeated short-term ozone damage to children’s developing lungs may lead to reduced lung function in adulthood (e.g., see Daily 1-h maximum ozone concentration (ppb) Kunzli et al, 1997). In adults, ozone exposure may accelerate the natural decline in lung function that occurs as part of the normal aging process (e.g., see Detels, et al., 1987). One important new investigation, the California Children’s Health Study, suggests that long-term ozone exposure can increase the chances that children will develop asthma disease.
The O3–morbidity associations indicated by the epidemiological studies just presented are also supported by a large body of data from controlled human exposure studies that have demonstrated pathways by which ozone can damage the human body when breathed. Clinical studies have demonstrated decreases in lung function, increased frequencies of respiratory symptoms, heightened airway hyper-responsiveness, and cellular and biochemical evidence of lung inflammation in healthy exercising adults. For example, controlled exposure studies have found that prolonged controlled exposures of exercising men to levels of ozone common in present-day United States (only 80 ppb) resulted in significant decrements in lung function, induction of respiratory symptoms, increases in nonspecific airway reactivity, and cellular and biochemical changes in the lung (e.g., see Devlin et al., 1991).
Potential Human Health Effects Of Air Pollution-Related Climate Change
The global nature of air pollution dispersion raises the issue of the potential impacts on global climate change of human emissions of carbon dioxide (CO2) and other greenhouse gases such as methane (CH3). These gases are natural constituents of the atmosphere, and they are necessary for the maintenance of the Earth’s climate in that they prevent the planet from being much colder than it presently is. However, since the dawn of the industrial age, mankind has begun to steadily increase the release of massive amounts of these greenhouse gas pollutants through the combustion of fossil fuels, which had previously safely stored the carbon far below the Earth’s surface in layers of sediments from eons ago. The release of this pollution has not only local consequences in terms of the potential human health effects from the particulate and gaseous pollutants that result, but also has the global potential to both raise the average global temperature and change the North–South temperature gradient of temperature, thereby causing disruptions in the weather patterns around the globe. These changes may also cause an increase in the worldwide sea level of the oceans, potentially causing the flooding of islands and low-lying shorelines around the globe. These changes, while to-date within the range of past climate variations, can nonetheless cause needless major disruptions in the economies and shorelines of countries around the world. Furthermore, they will also have the potential for major changes in global public health, because the occurrence of heat-related illness and infectious disease would also be likely to increase by rising global temperatures. Since many measures to address this potential problem will probably involve a reduction in the combustion of fossil fuels, and since a reduction of their emissions will also reduce the release of the health-related air pollutants (such as PM and O3), there will be local air pollution-related public health benefits that will accrue to cities, states, and nations that take measures to control climate change by reducing fossil fuel combustion (Cifuentes et al., 2001; Thurston, 2007).
Bibliography:
- Bates DV (1995) Ozone: A review of recent experimental, clinical, and epidemiological evidence, with notes on causation, Part 1, Part 2. Canadian Respiratory Journal 2(1): 25–31, 161–171.
- Bell ML, McDermott A, Zeger SL, Samet JM, and Dominici F (2004) Ozone and short-term mortality in 95 US urban communities, 1987–2000. Journal of the American Medical Association 292(19): 2372–2378.
- Cifuentes L, Borja-Aburto VH, Gouveia N, Thurston G, and Davis DL (2001) Climate change. Hidden health benefits of greenhouse gas mitigation. Science 293(5533): 1257–1259.
- Costa DL and Dreher KL (1997) Bioavailable transition metals in particulate matter mediate cardiopulmonary injury in healthy and compromised animal models. Environmental Health Perspectives 105S(Suppl 5): 1053–1060.
- Detels R, Tashkin DP, Sayre JW, et al. (1987) The UCLA population studies of chronic obstructive respiratory disease. 9. Lung function changes associated with chronic exposure to photochemical oxidants; a cohort study among never-smokers. Chest 92(4): 594–603.
- Devlin RB, McDonnell WF, Mann R, et al. (1991) Exposure of humans to ambient levels of ozone for 6.6 hours causes cellular and biochemical changes in the lung. American Journal of Respiratory Cell and Molecular Biology 4(1): 72–81.
- Dockery DW, Pope CA III, Xu X, et al. (1993) An association between air pollution and mortality in six U.S. cities. New England Journal of Medicine 329: 1753–1759.
- Gent JF, Triche EW, Holford TR, et al. (2003) The association of low level ozone and fine particles with respiratory symptoms in children with asthma. Journal of the American Medical Association 290: 1859–1867.
- Godish T (2003) Air Quality. 4th edn. Boca Raton, FL: CRC Press.
- Health Effects Institute (2003) Revised Analyses of Time-Series Studies of Air Pollution and Health. Special Report. Boston, MA: Health Effects Institute.
- Ito K, De Leon SF, and Lippmann M (2005) Associations between ozone and daily mortality: analysis and meta-analysis. Epidemiology 16(4): 446–457.
- Kleinman MT (2000) Carbon monoxide. In: Lippmann M (ed.) Environmental Toxicants: Human Exposures and their Health Effects. Hoboken, NJ: Wiley.
- Kunzli N, Lurmann F, Segal M, Ngo L, Balmes J, and Tager IB (1997) Association between lifetime ambient ozone exposure and pulmonary function in college freshmen–results of a pilot study. Environmental Research 72(1): 8–23.
- Lall R and Thurston G (2006) Identifying and quantifying transported vs. local sources of New York City PM2.5 fine particulate matter air pollution. Atmospheric Environment 40: S333–S346.
- Levy JI, Chemerynski SM, and Sarnat JA (2005) Ozone exposure and mortality: an empiric Bayes metaregression analysis. Epidemiology 16(4): 458–468.
- Medina-Ramon M, Zanobetti A, and Schwartz J (2006) The effect of ozone and PM10 on hospital admissions for pneumonia and chronic obstructive pulmonary disease: A national multicity study. American Journal of Epidemiology 163(6): 579–588.
- Ministry of Health of Great Britain (1954) Report on Public Health and Medicine. Subjects: Mortality and Morbidity During the London Fog of December 1952. London: Her Majesty’s Stationary Office.
- Ozkaynak H and Thurston GD (1987) Associations between 1980 U.S. mortality rates and alternative measures of airborne particle concentration. Risk Analysis 7(4): 449–461.
- Peters A, Dockery DW, Muller JE, and Mittleman MA (2001) Increased particulate air pollution and the triggering of myocardial infarction. Circulation 103(23): 2810–2815.
- Pope CA III, Burnett RT, Thun MJ, et al. (2002) Lung cancer, cardiopulmonary mortality and long-term exposure to fine particulate air pollution. Journal of the American Medical Association 287(9): 1132–1141.
- Schelegle ES and Adams WC (1986) Reduced exercise time in competitive simulations consequent to low level ozone exposure. Medicine and Science in Sports and Exercise 18(4): 408–414.
- Schwartz J (1997) Health effects of air pollution from traffic: ozone and particulate matter. In: Fletcher T and McMichael AJ (eds.) Health at the Crossroads: Transport Policy and Urban Health. New York: John Wiley and Sons Ltd.
- Smith KR, Mehta S, and Maeusezahl-Feuz M (2004) Indoor smoke from household solid fuels. In: Ezzati M, Rodgers AD, Lopez AD, and Murray CJL (eds.) Comparative Quantification of Health Risks: Global and Regional Burden of Disease due to Selected Major Risk Factors Volume 2, pp. 1435–1493.
- Geneva, Switzerland: World Health Organization. Thompson CR, Hensel EG, and Katz G (1973) Outdoor-indoor levels of six air pollutants. Journal of the Air Pollution and Control Association 23: 881–886.
- Thurston GD (2007) Air Pollution, Health Effect, Climate Change, and You. (Editorial) Thorax 62(9): 748–749.
- Thurston GD, Ito K, Kinney PL, and Lippmann M (1992) A multi-year study of air pollution and respiratory hospital admissions in three New York State metropolitan areas: results for 1988 and 1989 summers. Journal of Exposure Analysis and Environmental Epidemiology 2(4): 429–450.
- Thurston GD, Lippmann M, Scott MB, and Fine JM (1997) Summertime haze air pollution and children with asthma. American Journal of Respiratory and Critical Care Medicine 155(2): 654–660.
- Thurston GD and Ito K (2001) Epidemiological studies of acute ozone exposures and mortality. Journal of Exposure Analysis and Environmental Epidemiology 11(4): 286–294.
- Thurston G, Ito K, Mar T, et al. (2005) Workgroup report: Workshop on source apportionment of particulate matter health effects – Intercomparison of results and implications. Environmental Health Perspectives 113(12): 1768–1774.
- S. EPA (2000a) SO2 – How Sulfur Dioxide Affects the Way We Live & Breathe. Washington, D.C: U.S. EPA, Office of Air Quality Planning & Standards.
- S. EPA (2000b) National Air Quality and Emissions Trends Report. Washington, D.C: U.S. EPA, Office of Air Quality Planning & Standards. EPA 454/R-00–003.
- S. EPA (2003) National Air Quality and Emissions Trends Report, 2003 Special Studies Edition: Impact of April 2001 Asian Dust Event on Particulate Matter Concentrations in the United States. Washington, D.C: U.S. EPA, Office of Air Quality Planning & Standards. EPA454/ R-03–005.
- S. EPA (2004) Air Quality Criteria for Particulate Matter (Final). Washington, D.C: U.S. EPA, Office of Research and Development. EPA/600/P-99/002aF.
- S. EPA (2006) Air Quality Criteria for Ozone and Related Photochemical Oxidants (Final). Washington, D.C: U.S. EPA. EPA/600/R-05/004aF-cF.
- Washington Post (2006) Era of Leaded Gas Comes to an End in Most of Africa: Gains in Air Quality, Health Expected. January 1, 2006; p. A14.
- Wayne WS, Wehrle PF, and Carroll RE (1967) Oxidant air pollution and athletic performance. Journal of the American Medical Association 199(12): 901–904.
- WHO (1982) Estimating Human Exposures to Air Pollutants. Offset Pub. No. 69. Geneva, Switzerland: World Health Organization.
- WHO (2002) World Health Report: Comparing Risks. Geneva, Switzerland: World Health Organization.
- McDonnell WF, Kehrl HR, Abdul-Salaam S, et al. (1991) Respiratory response of humans exposed to low levels of ozone for 6.6 hours. Archives of Environmental Health 46(3): 145–150.
See also:
Free research papers are not written to satisfy your specific instructions. You can use our professional writing services to buy a custom research paper on any topic and get your high quality paper at affordable price.
ORDER HIGH QUALITY CUSTOM PAPER

Always on-time

Plagiarism-Free

100% Confidentiality


