
This sample Color Blindness Research Paper is published for educational and informational purposes only. Free research papers are not written by our writers, they are contributed by users, so we are not responsible for the content of this free sample paper. If you want to buy a high quality research paper on any topic at affordable price please use custom research paper writing services.
Abstract
The scientific definition of color blindness is explained, emphasizing that this denomination is not only applied to people without color experiences (monochromats) but also to all with no-common color experiences (dichromats and anomalous trichromats). Clinical nomenclature in color-blind diagnosis is described, specifying the causal origin of each color-blind type. The different action types available to applied psychologists to help color-blind people are described (diagnosis, perceptual problems detection, use of specific information, creation-selection of accurate materials, etc.).
Outline
- Introduction
- Using the Anomaloscope to Diagnose: Photoreceptors and Types of Color Blindness
- Causes of Color Blindness
- Color Blindness and Psychological Intervention
1. Introduction
The existence of metamer stimuli (i.e., physically different but perceptually identical) has psychological implications that are essential to understand the functional logic of color perception in both normalsighted and color-blind people. Figure 1 shows the spectracolorimetric measurement of two metamers. The upper portion (Fig. 1A) is a physical description of the light reflected by a white shirt. The middle portion (Fig. 1B) corresponds to the light from this object as reproduced on a conventional television screen. It is easy to observe considerable differences between these two physical stimuli that, nonetheless, produce the same perceptual experience (‘‘white’’).
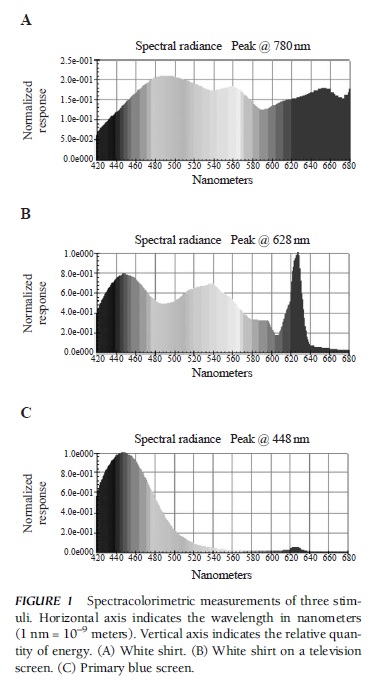
FIGURE 1 Spectracolorimetric measurements of three stimuli. Horizontal axis indicates the wavelength in nanometers (1 nm = 10–9 meters). Vertical axis indicates the relative quantity of energy. (A) White shirt. (B) White shirt on a television screen. (C) Primary blue screen.
The existence of metamers casts serious doubts on what could be called the ‘‘commonsense theory of color perception and color blindness.’’ This theory can be summarized in the following three ideas:
- Color is a physical property of light (e.g., the light reflected by blood is red, the light reflected by a lawn is green).
- The function of our visual system consists exclusively of detecting such properties from the stimulation that reaches the retina.
- Color blindness would derive from the visual system’s limitations to detect the presence of some color (e.g., difficulty in detecting the presence of red).
From the viewpoint of the commonsense theory, the existence of metamers implies that all humans are color-blind because they experience the same color in response to physically different stimuli. It must be emphasized that such stimuli generate different color experiences when presented to other animal species (e.g., the stimuli from Figs. 1A and 1B are not metamers for bees and pigeons). Consequently, it can be concluded that the essential difference between normal-sighted and color-blind people is quantitative and not qualitative: All of them have metamers, but color-blind people have more or them. Although this conclusion is correct, a different conclusion can be inferred regarding the main premise of the commonsense theory because color is not a physical property of light. Instead, it is a property of the perceptual response generated in reaction to light, as was explicitly stated by Isaac Newton in his book Optics: ‘‘The rays, to speak properly, are not coloured. In them there is nothing else than a certain power and disposition to stir up a sensation of this or that colour.’’
Following Newton’s ideas, the next section reveals the nature of the ‘‘certain power and disposition’’ present in physical stimuli and, even more important, how our visual system produces ‘‘a sensation of this or that colour’’ in response to them. Subsequently, it will be easy to conclude that the most important difference between normal-sighted and color-blind people is that the latter have a reduced capacity to detect energetic imbalances in light and, consequently, to produce color experiences.
2. Using The Anomaloscope To Diagnose: Photoreceptors And Types Of Color Blindness
Color perception is the result of a complex visual processing sequence, initiated in the retina photoreceptors, that involves a large number of brain centers. Consequently, any anomaly in this sequence can generate some type of color blindness. However, most of the problems related to color perception are caused by some functional anomaly in a photoreceptor type. Consequently, this analysis centers on these anomalies. There are two types of photoreceptors in the human retina: cones and rods. Cones are especially relevant to understanding color perception and can be divided into three types (continuous curves in Fig. 2), depending on the relative position of their spectral sensitivity curves. In the standardized scientific nomenclature, these types are called ‘‘L’’ (long), ‘‘M’’ (medium), and ‘‘S’’ (short), depending on the portion of the spectrum that produces larger responses for each type of cone. Taking into account the relative curve position and counting from right to left, the clinical nomenclature calls the three cone types ‘‘proto,’’ ‘‘deutera,’’ and ‘‘trita,’’ respectively (corresponding to the Greek words for ‘‘first,’’ ‘‘second,’’ and ‘‘third’’). Recent genetic evidence indicates that, at least for the L and M cones, the spectral response curves present minor interindividual differences among normal-sighted people (discontinuous curves in Fig. 2).
The analysis of cone responses is useful to understand (a) the origin of metamers, (b) their more widespread presence among color-blind people and the various types of color blindness, and (c) how they could be diagnosed using an anomaloscope. Each of these aspects is considered in turn.
2.1. The Origin of Metamers
Despite their physical differences, the two metamers in Figs. 1A and 1B share an essential characteristic: They both present important energy accumulations in the three spectrum portions (long, medium, and short). That is why both stimuli generate high responses in the three cone types. Cone response similarity is the cause of the achromatic sensation generated (‘‘white’’). On the other hand, the stimulus represented in Fig. 1C accumulates energy in only one spectrum portion (the short one) and, consequently, generates an imbalance in the relative responses of the three cone types (the S cones have a larger response). This imbalance causes a chromatic sensation (‘‘blue’’). To summarize, first, the energetically unbalanced stimuli (more energy in any spectrum portion) tend to generate imbalances in the relative responses of the three cone types and, consequently, the generation of hue experiences (e.g., blue, green, purple). Second, the specific hue experienced depends on the type of imbalance detected by the cones. Third, all physical stimuli that generate the same pattern of response in the cones are metamers. For example, all stimuli that produce the same predominance of the S cones over the other cones will generate the same blue perception, and all stimuli that produce high and similar responses in the three cone types will generate the same white perception.
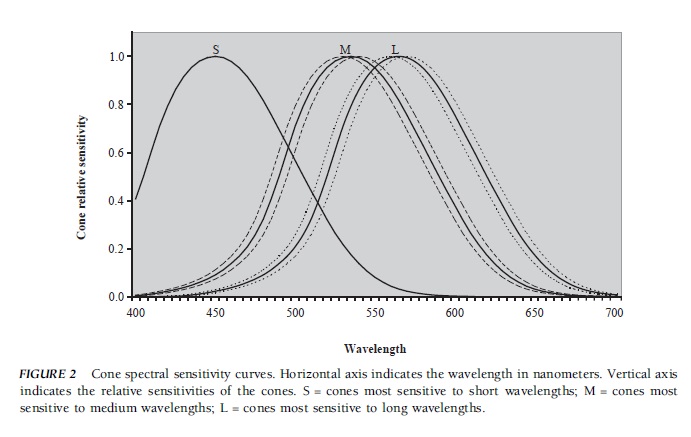 FIGURE 2 Cone spectral sensitivity curves. Horizontal axis indicates the wavelength in nanometers. Vertical axis indicates the relative sensitivities of the cones. S = cones most sensitive to short wavelengths; M = cones most sensitive to medium wavelengths; L = cones most sensitive to long wavelengths.
People with only one photoreceptor type lack the ability to detect energetic imbalances and are called ‘‘monochromats.’’ Their vision is very similar to that experienced by normal-sighted people when watching a black and white film. The psychophysical characteristic of these individuals is that, by performing the necessary intensity adjustments, they can experience any pair of wavelengths as metamers. Equation (1) synthesizes the cause of this fact. As can be observed, the response (R) in the type of cone available depends on the relative wavelength visual efficacy (EFx ) and physical intensity (Ix) of the stimulus:
R = EFx * Ix (1)
2.2. Metamers and Types of Color-Blind People
The term ‘‘scotopic vision’’ refers to the kind of vision mediated by rods. When the illumination level is reduced and the cones become inoperative, vision depends on the rods and all humans become monochromats because they see with only one type of photoreceptor. Consequently, all of the variations have a quantitative characteristic and can be described using Eq. (1). Monochromatic vision is the only type of vision available to people who lack cones (rod monochromats). In addition, these individuals have severe acuity problems (similar to normal-sighted people at night, they cannot detect subtle details) and must use sunglasses permanently to reduce the amount of light reaching their eyes. Also considered monochromats are individuals with only one cone type (the S cone), although they do not have photophobia or acuity problems. Strictly speaking, only monochromats should be called ‘‘color-blind’’ people because they are the only ones whose visual world is similar to that of normal-sighted people when watching a black and white film. However, monochromats comprise only a small portion of the people who are usually called color-blind.
People lacking a certain type of cone are dichromats. In the clinical taxonomy, this condition is indicated by using the suffix ‘‘anope’’ after the cone denomination. Thus, people lacking L cones (protocones) are protanopes, people lacking M cones are deuteranopes, and people lacking S cones are tritanopes. To reach a better understanding of dichromats’ color limitations, a brief description of the most prestigious diagnostic test, the Nagel analytic anomaloscope, is presented.
2.3. Diagnosing Dichromatism and Anomalous Trichromatism with an Anomaloscope
The Nagel anomaloscope uses three monochromatic stimuli of 546, 589, and 670 nm (vertical lines in Fig. 3). These values are out of the operative range of the S cones (not represented in Fig. 3). Consequently, the next analysis can focus on the other two cone types: the M cones (thick left curve in Fig. 3) and the L cone (thick right curve in Fig. 3).
The anomaloscope shows a circle divided into two halves. One half is used to present the reference stimulus, a monochromatic stimulus with a wavelength of 589 nm (represented by the central vertical line in Fig. 3). To make the explanation simpler, assume that presentation of the reference stimulus generates similar activation levels in both cone types (L and M) and that, because of this, a yellow experience is generated. The second half of the circle presents a mixture of 546 and 670-nm light (represented, respectively, by the left and right vertical lines in Fig. 3). For a normal-sighted person, a 546-nm monochromatic stimulus generates more response in the M cones than in the L cones and, consequently, the perception of green. On the other hand, the 670-nm monochromatic light is experienced as reddish because it generates a larger response in the L cones than in the M cones.
The use of a Nagel anomaloscope requires adjusting the quantities of both mixture components (the greenish and the reddish light) to match the reference stimulus. For a normal-sighted person, this means that the mixture should similarly activate the M and L cones and, therefore, produce the same yellow experience as does the reference stimulus. These adjustments are performed very precisely because every variation in the relative quantities of the mixture components will produce a greenish or reddish hue and, consequently, an easily noticeable difference in relation to the reference color.
When carrying out Nagel anomaloscope adjustments, the more common dichromat types (protanopes and deuteranopes) are not as consistent as normal-sighted people. This is because the three stimuli used act on the same cone type, that is, the only one they have (remember that S cones are irrelevant to this analysis). Consequently, the situation is very similar to the one described by Eq. (1); the response (R) generated by the reference stimulus can be metamerized by any of the two mixture stimuli presented individually, or by any combination of both mixture stimuli (given the accurate quantities).
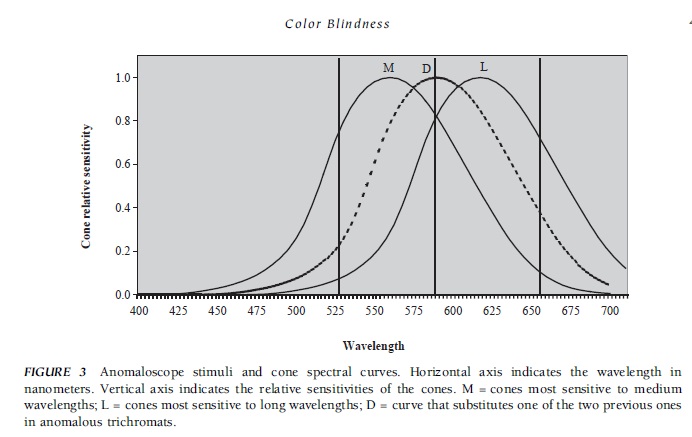 FIGURE 3 Anomaloscope stimuli and cone spectral curves. Horizontal axis indicates the wavelength in nanometers. Vertical axis indicates the relative sensitivities of the cones. M = cones most sensitive to medium wavelengths; L = cones most sensitive to long wavelengths; D = curve that substitutes one of the two previous ones in anomalous trichromats.
Anomalous trichromats are the next group of colorblind people to be considered. This group consists of all people who, like normal-sighted people, have three cone types in their retinas (this is why they are trichromats) but whose spectral curve responses are somewhat different from those represented in Fig. 2 (this is why they are anomalous). The most important consequence of this is that anomalous trichromats perceive as metamers certain stimuli perceived as different by normal-sighted people.
Nowadays, it is commonly assumed that the anomalous trichromat’s limitations in differentiating colors, and the peculiar way in which these are perceived, derive from an exaggerated overlapping of the spectral response curves of two cone types. To understand why, the D curve in Fig. 3 must be used to substitute one of the two continuous curves (the M or L curve). With the new pair of curves, the relative differences in the response of both cone types to any stimulus are reduced, as is the ability to discriminate colors—the more overlapping there is, the less ability to discriminate. At the limit, a full overlapping of curves would make both cone types functionally equivalent, and these people would behave like dichromats.
3. Causes Of Color Blindness
Most color blindness is genetic in origin. In this group, the alterations associated with problems in the L cones (protanopia and protanomalies) or in the M cones (deuteranopia and deuteranomalies) are collectively called ‘‘daltonisms’’ or ‘‘red–green problems.’’ These problems affect many more men (5–10%) than women (<0.9%) because they are associated with genetic alterations in recessively transmitted X chromosomes. Consequently, men will express red–green problems when there are anomalies in the only X chromosome they have. On the other hand, a women must have problems in both X chromosomes to be daltonic. With only one affected chromosome, they will show a normal use of colors but can transmit the red–green disturbance to their offspring. The most important gene in relation to the opsin characteristic of S cones is not located in sexual chromosomes; instead, it is located in the seventh pair of chromosomes. Consequently, problems associated with these cones have a similar incidence in men and women. These types of color blindness are transmitted dominantly, but they affect a very small number of people (<0.05%).

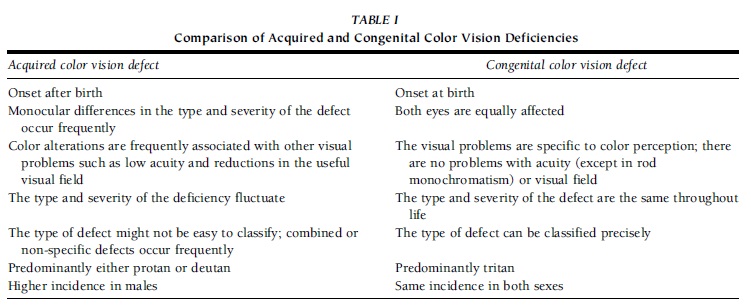 TABLE I Comparison of Acquired and Congenital Color Vision Deficiencies
Although the chromosomes associated with rod monochromatism have not yet been identified, this type of problem is known to be transmitted recessively. Consequently, the affected gene must be located in both chromosomes to produce problem expression.
Defective color vision can be acquired by any kind of agent with the capacity to disturb the normal functioning of the visual system—the result of ocular pathology, intracranial injury, the use of therapeutic drugs, aging, and so on. Frequently, color disturbances are initial symptoms of pathologies and can be used for early detection, indicating when therapeutic measures should begin or when they should be discontinued. Table I reviews the most important differences between acquired and congenital color deficiencies.
4. Color Blindness And Psychological Intervention
4.1. Problems And Solutions: A Case Of Protanopia
Mr. X works as an editor for a famous Spanish scientific dissemination journal. This activity is not severely handicapped by color blindness, according to various studies. Mr. X was diagnosed as a protanope some years ago. Although his perceptual limitations made it difficult for him to perform tasks in the same way as other people do, he had no problems after carrying out some modifications in his work environment. His past difficulty in correcting page galley proofs and the way in which he ‘‘solved’’ this problem are an example. This protanope used to receive printed pages on which the errors to be corrected were indicated by red pencil marks. For a normal-sighted person, locating red marks is a very easy task because they ‘‘pop up’’ over the black letter background. However, for Mr. X, dark red and black colors are very similar (nearly metamers), so red marks did not ‘‘pop up’’ from his perspective. Consequently, he missed many error marks. How did he prevent this situation? Very simply: by using a color that would stand out over the background of black letters. In his case, blue ink was a very appropriate solution.
The kind of difficulty described in the previous paragraph has been experienced for centuries. To avoid them, people usually adopt one of two alternatives. Either color-blind people are denied access to some tasks and/or activities, or some task modifications are carried out to make them accessible to color-blind people. In any case, neither of these alternatives is viable in the absence of an accurate chromatic vision diagnosis.
4.2. Detecting and Diagnosing Color Blindness: A Two-Step Strategy
Pseudoisochromatic tests (Fig. 4) use stimuli that are very similar in color (‘‘isochromatic’’) for color-blind people but not for normal-sighted people (‘‘pseudo’’). For example, in the famous Ishihara test (Fig. 4A), color-blind people have difficulty in reading the number presented in each plate. This is because they do not perceive enough differences between the points that form the number and the background. Another similar example is provided by a test, called the ‘‘TIDA,’’ to detect color-blind children. In this case (Fig. 4B), color-blind individuals of the red–green type select some greenish and reddish monkeys from the bottom line as being similar (‘‘belonging to the same family’’) to the larger gray monkeys presented in the upper line.
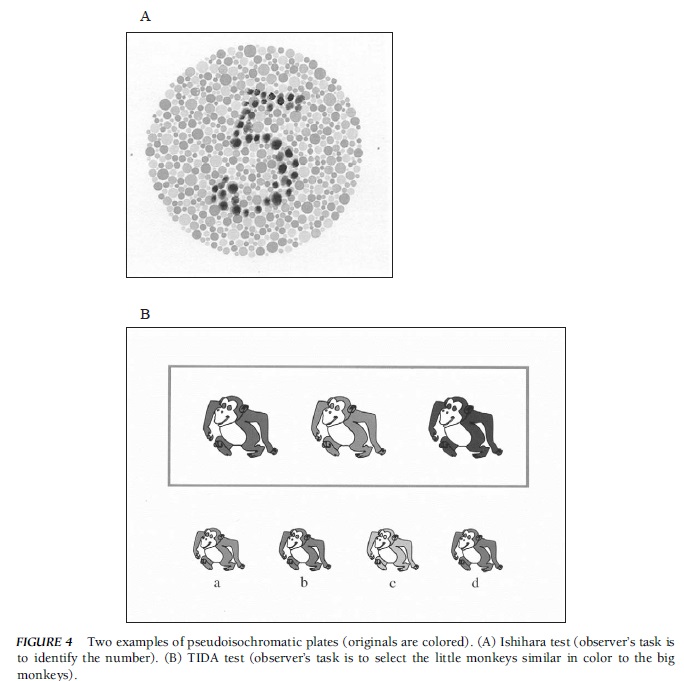 FIGURE 4 Two examples of pseudoisochromatic plates (originals are colored). (A) Ishihara test (observer’s task is to identify the number). (B) TIDA test (observer’s task is to select the little monkeys similar in color to the big monkeys).
Because they are easily constructed and applied, there are many pseudoisochromatic tests available for using during the first stage of the diagnostic process to detect the presence of color blindness. However, their use must be complemented, during a second stage, with an anomaloscope to get the most accurate diagnosis. Among the pseudoisochromatic tests capable of detecting a red–green anomaly are the following: the Ishihara test; the Dvorine test; the Hardy, Rand, and Rittler (HRR test); the D-15 test; and the City University Color Vision Test. The latter three tests are also useful for detecting tritan anomalies and for grading the severity of the color perception problem.
Anomaloscopes show users a circle divided into two halves. One half is used to present the reference stimulus and must be metamerized in the other half by a stimulus mixture. As indicated previously, to detect and differentiate red–green problems, a Nagel match must be used.
This kind of match uses a reference stimulus of 589 nm (yellow for a normal-sighted person) and an adjustable stimulus mixture made up of 546 nm (green for a normal-sighted person) and 670 nm (red for a normal sighted person). To detect and differentiate among tritan problems, the Moreland match must be used. This uses a reference stimulus made up of a mixture of 480 nm (greenish blue for a normal-sighted person) and 580 nm (yellow for a normal-sighted person) and an adjustable stimulus mixture made up of 436 nm (blue for a normal-sighted person) and 490 nm (bluish green for a normal-sighted person).
4.3. After Diagnosis: Trying to Compensate for Perceptual Limitations
Gaining awareness of people’s color blindness and perceptual limitations is the first step in the process of obtaining psychological help. With this knowledge, color-blind people can avoid incorrect attributions about the causes of their perceptual difficulties, and just as important, they obtain a first cue to adopt compensatory interventions. More concretely, and returning to the case discussed earlier, Mr. X’s awareness of his perceptual peculiarities prevented him from attributing his difficulty in locating red marks to cognitive or motivational factors. He never thought that his difficulties were due to an attentional deficit. Eventually, he realized that his problems were the consequence of his difficulty in differentiating the dark red ink marks from the black letters, and so he was able to suggest the use of blue ink.
Knowing that a person is color-blind, the psychologist should look for, and try to compensate for, the following two kinds of problems:
- Difficulty in performing figure–background segmentations
- Difficulty in using the basic chromatic categories
4.3.1. Figure–Background Segmentation Difficulties
Many computer users are familiar with the following situation. Initially, they used a common application (e.g., Microsoft PowerPoint) to present a colored written message on a colored background (e.g., yellow letters on a green background). Of course, this message is easy to read on the original screen because the letters used have an adequate lightness contrast with the background.
However, when another screen is used to present the same message (e.g., a large screen used in a classroom), the message becomes very difficult to read due to a reduction in the lightness contrast. The cause of this problem is simply that the same document, as well as the same software specification, produces different colors on different screens.
A problem very similar to the one just described is relatively frequent for some types of color-blind people because, when looking at some stimuli, they experience lightness contrasts that are different from those experienced by normal-sighted people. For example, protanopes perceive reddish backgrounds as darker and, consequently, have difficulty in reading black letters on reddish backgrounds. They also have difficulty in detecting when a red light is on because they perceive it as less brilliant than do normal-sighted people.
Color-blind people not only have figure–background segmentation problems derived from their peculiar lightness perception, but a similar type of problems also may be a consequence of their restricted gamut of chromatic experiences. To understand the origin of this type of difficulty, consult Fig. 3 again and remember that, for some dichromats, the three stimuli used by the anomaloscope affect the responses of only one cone type. Consequently, when presented with the precise physical intensity (see Eq. 1), the exact same color experience is produced in these people, although normal-sighted people would perceive very different hues (green, yellow, and green) in response to these stimuli.
4.3.2. Problems Related to the Use of Basic Chromatic Categories
The expression ‘‘basic chromatic categories’’ is used to name the linguistic categories consistently used among speakers of a certain language. For the languages in most developed countries (e.g., English, Spanish, Japanese), there are 11 categories. These are identified in English by the following terms: red, green, blue, yellow, white, black, brown, orange, purple, pink, and gray. To say that these categories are used consistently means that, for example, if an observer is required to select the prototype of one of these categories, he or she will select the same one, or a very similar one, on different occasions. These choices will also be very similar to the equivalent choices performed by other normal-sighted people.
Previously, the singular adjustments performed by color-blind people in a Nagel anomaloscope were described. Specifically, it was indicated that stimuli belonging, for normal-sighted people, to the red, green, and yellow categories can be metamers for red–green dichromats. Taking this into account, and also considering that color-blind people generally have an increased number of metamers, it is logical to expect color-blind people to have severe difficulties when using basic chromatic categories. In contrast to this expectation, research carried out with 30 dichromat children (protanopes and deuteranopes) provided the results presented in Fig. 5. The children achieved an important level of ‘‘hits’’ when required to name prototypical exemplars of the 11 basic Spanish chromatic categories. Moreover, for five basic categories (yellow, green, blue, red, and white), their hit percentage was more than 85%.
Why is there such disparity between, on the one hand, the low discriminative level shown by color-blind people in response to the stimuli used by diagnostic tests and, on the other, their relatively high capacity to name prototypes? What is the practical relevance of this fact? These questions are addressed in turn.
The main difference between the stimuli used in an anomaloscope and the stimuli provided by everyday chromatic surfaces is the range of available intensities. For example, when using a Nagel anomaloscope, the wavelengths that a normal-sighted person perceives as green (546 nm), yellow (589), and red (670 nm) can be presented with a broad range of physical intensities. Consequently, differences in the capacity to activate cone responses can be compensated by intensity variations (see Eq. 1). This compensation is not possible with surface colors in which the response intensity (perceived lightness) is very closely related to the specific wavelengths reflected. So, for red–green dichromats, the yellow prototype is always perceived with a higher lightness than is the green or red prototype. Of course, this also helps these individuals to avoid naming confusions. This does not occur when no prototypical exemplars of the basic categories are used (e.g., pale green), in response to which more naming errors are produced.
Because many everyday chromatic stimuli are close to the basic chromatic category prototypes, color-blind people can frequently name a color correctly (Fig. 5). Consequently, for example, many teachers frequently do not agree with the results provided by the standardized chromatic vision evaluation procedure because these results are always worse than children’s real capacity to name and differentiate everyday chromatic materials. Taking this into consideration, should we conclude that chromatic evaluation is useless? The answer is clearly no because color blindness detection alerts one to the problems with figure–background segregation discussed previously and, logically, because these individuals continue to have more trouble in naming and using color categories than do normal-sighted people, even when prototype exemplars are used (Fig. 5).
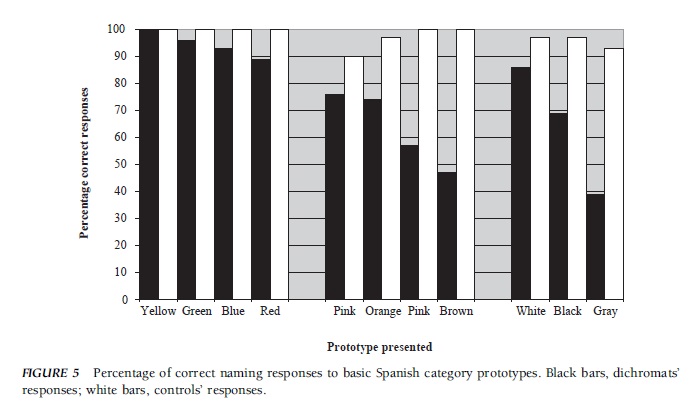 FIGURE 5 Percentage of correct naming responses to basic Spanish category prototypes. Black bars, dichromats’ responses; white bars, controls’ responses.
References:
- Birch, J. (1993). Diagnosis of defective color vision. Oxford, UK: Oxford Medical Publications.
- Fletcher, R., & Voke, J. (1985). Defective color vision: Fundamentals, diagnosis, and management. Boston: Adam Hilger.
- Hsia, Y., & Graham, C. H. (1997). Color blindness. In A. Byrne, & D. R. Hilbert (Eds.), Readings on color: The science of color. Cambridge, MA: MIT Press. (Original work published 1965).
- Kaiser, P. K., & Boynton, R. M. (1996). Human color vision (2nd ed.). Washington, DC: Optical Society of America.
- Mollon, J. D., Pokorny, J., & Knoblauch, K. (2003). Normal and defective colour vision. Oxford, UK: Oxford University Press.
- Newton, I. (1952). Optics (4th ed.). New York: Dover. (Originally published 1730).
See also:
Free research papers are not written to satisfy your specific instructions. You can use our professional writing services to order a custom research paper on any topic and get your high quality paper at affordable price.
ORDER HIGH QUALITY CUSTOM PAPER

Always on-time

Plagiarism-Free

100% Confidentiality
