
This sample Variance Research Paper is published for educational and informational purposes only. If you need help writing your assignment, please use our research paper writing service and buy a paper on any topic at affordable price. Also check our tips on how to write a research paper, see the lists of research paper topics, and browse research paper examples.
The variance is a measure of variability among scores. In describing any set of data, one uses three characteristics: the form of the distribution, the mean or central tendency, and the variability. All three are required because they are generally independent of one another. In other words, the mean indicates nothing about the variability.
Variability is a characteristic of all measures. In the social sciences the people or groups that are studied may be exposed to the same treatment or conditions but will show different responses to that treatment or those conditions. In other words, all the scores of the people would be different. The goal of the scientist is to explain why the scores are different. One can think of a score as having two parts: the mean and a deviation from the mean (Hays 1973). If everyone were exactly the same, the variability among scores (deviations from the mean) would be zero.
In manipulating conditions or treatments it is possible to explain different scores between groups by looking at the variability between the groups and also within each group. If the groups are different enough, it is said that they are statistically significantly different. Statistical significance is determined by looking at the probability (odds) that a difference could have occurred by chance. One analyzes the data by looking at the variability of the data and breaking down that variability into its component parts.
There are several methods for measuring variability among scores. The range is the difference between the highest and lowest scores and is limited because it is based on only two scores. It is not very useful because it is influenced easily by extremes among the scores. The mean deviation score sometimes is used as a measure of variability but also is limited in terms of its usefulness in additional mathematical calculations. The standard deviation is used commonly; it is simply the square root of the variance.
The variance is the most useful of these methods. It is defined as the sum of the squared deviations from the mean divided by the number of squared deviations. The equation for the variance is , where
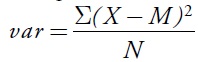

var is the variance, X is a raw score, M is the mean of the scores, X—M represents the deviation of a score from the mean, and N is the number of scores. Many different symbols have been used to represent the elements of this equation, but in all cases the variance is the average of the squared deviations from the mean.
A simple numerical example can illustrate the variance. There is a small set of five scores: 8, 7, 6, 5, and 4. The sum of those scores is 30, and the mean is 6. The numerator in the variance equation is called the sum of the deviation scores squared (often abbreviated SS for sum of squares). One takes each score and subtracts the mean (i.e., 8 – 6 = 2; 7 – 6 = 1; 6 – 6 = 0; 5 – 6 = -1; and 4 – 6 = -2). Next, the deviation scores are squared to eliminate the minus signs (22 = 4; 12 = 1; 02 = 0; -12 = 1; and -22 = 4). Then one simply adds the deviation scores squared (4; 1; 0; 1; and 4) to get the SS, which is equal to 10. Finally, the variance is calculated by dividing the SS by the number of scores (N), which in this example is 10/5 = 2. The variance for this small set of five scores is 2.
This example illustrates an important point: The variance is not a clear indicator of variability. Consider the scores in the example above as inches. The variance is 2 squared inches. How would one make sense out of a variability of squared inches? In the social sciences how would one interpret a variability of squared IQ, conformity, opportunity costs, and so on? The variance has no simple or particularly useful explanation in everyday language or in the technical jargon of the social sciences.
However, the variance is an essential mathematical step in describing parametric variability. The variance has the advantage of being additive, something that is not true for its square root, the standard deviation (Games and Klare 1967). This means that in working with more than one group and looking for a measure of pooled or average variability among the groups, one can add variances. This is done in many inferential parametric statistical tests.
The variance is an essential element of much social science data analysis but is not easily interpretable. The standard deviation, which is the square root of the variance, is used commonly to provide a more readily understandable indicator of variability.
Bibliography:
- Games, Paul A., and George R. Klare. 1967. Elementary Statistics: Data Analysis for the Behavioral Sciences. New York:McGraw-Hill.
- Hays, William Lee. 1973. Statistics for the Social Sciences. 2nd ed. New York: Holt, Rinehart and Winston.
See also:
Free research papers are not written to satisfy your specific instructions. You can use our professional writing services to buy a custom research paper on any topic and get your high quality paper at affordable price.
ORDER HIGH QUALITY CUSTOM PAPER

Always on-time

Plagiarism-Free

100% Confidentiality


