
This sample Vectors Research Paper is published for educational and informational purposes only. If you need help writing your assignment, please use our research paper writing service and buy a paper on any topic at affordable price. Also check our tips on how to write a research paper, see the lists of research paper topics, and browse research paper examples.
It is well known that any point in the plane can be represented by a pair of numbers, its coordinates. If one draws a horizontal axis, labeled the x axis, and a vertical axis, labeled the y axis, then one can represent any point uniquely by giving its x coordinate and its y coordinate in order. Point (a, b) is the point that lies directly on a vertical passing by the point marked a on the x axis and on level with the point marked b on the y axis. Naturally, a or b can be negative. Note that the order of the coordinates is important. Points represented by (a, b) and (b, a) are not the same (unless a = b).
There is a complete correspondence between geometrical objects, namely, points of the plane, and purely algebraic objects, namely, ordered pair of numbers. Such algebraic objects that correspond exactly to points are called vectors. Thus a vector is a pair of any numbers (x, y). More precisely, one should call such pairs two-dimensional vectors because the concept can be easily generalized to n-dimensional vectors, geometrical representation being of course limited to three-dimensional space; nonetheless, the illustrations herein are limited to two-dimensional space.
Economic applications of vectors are quite important and numerous. The presentation herein deals with consumption first, production and activity analysis second, and then finally, temporal processes.
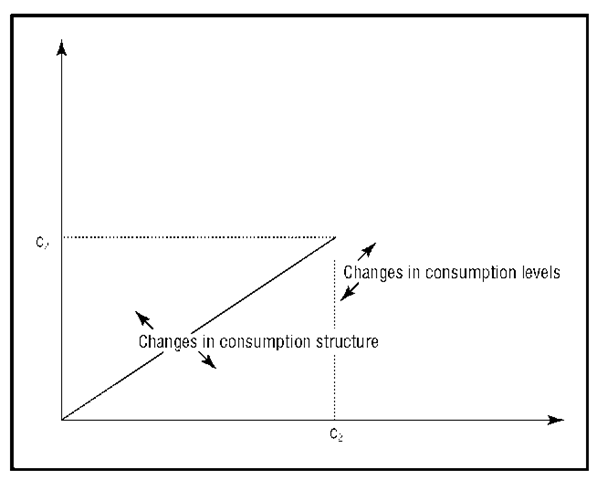
Consumption structures can be easily presented using vectors. The consumption of consumer C. consists of n different quantities or bundles of different commodities (meat, bread, beer, tea …), represented by Ci = (ci1, ci2, … (cin). When for simplicity of presentation one deals with two commodities, then n = 2 and Ci = (ci1, ci2), which can be represented with quantities consumed on relevant axes, as in Figure 1. The length of the vector represents the level of consumption, and its slope represents the structure of composition. Level changes of the “consumption basket” will be represented by an increase or a decrease of the vector length; changes in structure, depending on consumer preferences, revenue, and market prices, will modify the vector slope.
Vector analysis can also be useful to present problems of accumulation with heterogeneous capital goods, a technique dating as far back as Karl Marx’s analysis of “reproduction schemes” found in the second volume (1885) of Das Kapital. John von Neumann (1946) and Wassily W. Leontief (1941) have contributed important modern examples of this technique.
For an example of a production analysis, one might begin by defining an “activity,” “process,” or “production method” representing production of one commodity, say “corn,” using labor, iron, and corn (for seed needs). For one unit of labor time (one hour, one day, or labor time available in the economy), one can obtain a given amount of corn, called b11, using an amount of corn and a21 of iron. Consequently, activity can be represented by vector OM1 (see Figure 2). The first coordinate of Mj^ is bn – a11, representing “net” production of corn, that is, “gross” production of corn (b11) less intermediate consumption of corn (a11)—the seeds; the second coordinate, a21, represents the intermediate consumption of iron; vector OM1,representing the “net product” of activity (1), can be easily constructed by vectoral summation of, first, gross production of corn represented by vector Ob11 and second, D, vector OA1, itself sum of inputs of corn and iron.
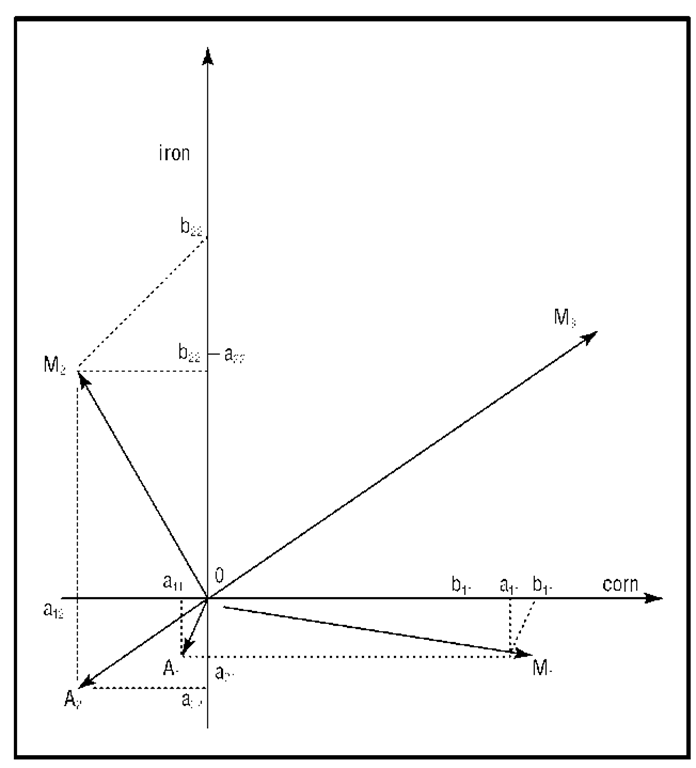
In a similar way, let iron be produced by another activity producing b22 units (tons …) of iron using a22 units of iron, a]2 units of the other commodity (corn here in this very simplified model), and one unit of labor. Vector OM2 represents the “net product” of this activity.

One may note that OM1 and Ofl2 have just one positive component, both activities being “specialized” in the production of one and only one commodity. Such a case is called “simple production”; but one may have a different case in which one activity produces two commodities simultaneously (say, wool and milk); in such a case, named “joint production,” both coordinates of M3 may be positive, as indicated in Figure 2 (this vector is shown only for mathematical illustration as it is quite difficult to imagine a method producing jointly iron and corn).
When both activities are specialized, one comes to matrix representations such as:
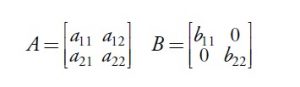
which are square matrixes largely used in input-output systems, or Leontief models—2 X 2 in the simplified model used here, but n X n in a more general treatment. The column vector represents conditions of production of the commodity (production of b11 units of commodity i necessitates intermediate consumption of an units of itself and a21 units of second commodity, and so on); the ieme line vector represents utilization of the ieme commodity by the entire system, as intermediate consumption (a11 representing intermediate consumption of first commodity by the first production process, a12 intermediate consumption of the same commodity by the second production process, and so on).
Von Neumann models are more complicated and more general. First, there is the possibility of joint production. Second, the matrix may be rectangular because there is the possibility of production systems with un-equality between the numbers of processes (line vectors) and commodities (column vectors).
It should be noted that when economic systems can be characterized by a “square matrix,” one can define and characterize eigenvectors that have a special structure associated with matrix characteristics. Such vectors play a special role in economic analysis because they can be useful to characterize, on the one hand, special accumulation regimes—with maximum uniform growth rates—and, on the other hand, special price systems—with minimum uniform interest rates.
Vectors can also be useful in presenting and generalizing about temporal interdependencies. Simple “auto-regressive” models involve the dependence of variable x on the anterior value of the same variable, for instance, Xf = f(xt — 1), with any kind of relevant function.
Vector autoregressive (VAR) models are a generalization of such simple autoregressive models. Consider two stationary variables x1 t and x2t; each variable depends on its own past values but also on the present and past values of the other one. VAR models are very important in contemporary econometrics. They have been introduced by Christopher A. Sims (1980) as an alternative to macro-econometric models with a Keynesian flavor.
Bibliography:
- Leontief, Wassily W. 1941. The Structure of American Economy, 1919–1929: An Empirical Application of Equilibrium Analysis. Cambridge, MA: Harvard University Press.
- Neumann, John von. 1946. A Model of General Equilibrium. Review of Economic Studies 13 (1): 1–9. (Orig. pub. 1937.)
- Sims, Christopher A. 1980. Macroeconomics and Reality. Econometrica 48 (1): 1–48.
See also:
Free research papers are not written to satisfy your specific instructions. You can use our professional writing services to buy a custom research paper on any topic and get your high quality paper at affordable price.
ORDER HIGH QUALITY CUSTOM PAPER

Always on-time

Plagiarism-Free

100% Confidentiality


