
This sample Long Term Care for Aging Populations Research Paper is published for educational and informational purposes only. If you need help writing your assignment, please use our research paper writing service and buy a paper on any topic at affordable price. Also check our tips on how to write a research paper, see the lists of health research paper topics, and browse research paper examples.
Long-term care (LTC) encompasses a wide range of health and social services including skilled and intermediate nursing care, assisted living, custodial or personal care, adult day care, respite care, home health care, and hospice care; LTC generally does not include care in short-stay hospitals (Actuarial Standards Board, 1999).
The primary use of LTC is among people with limitations in one or more activities of daily living (ADLs) or instrumental activities of daily living (IADLs), and people with cognitive impairment (CI), where the expected duration of the limitation or impairment is at least 3 months. Some people use LTC throughout their lives; more generally, the use of LTC increases exponentially with age, making it a significant health and financial risk for the elderly. Use of LTC is associated with developmental disabilities and mental illnesses, chronic diseases, injuries, disabling conditions, physiological frailty, and dementia. LTC use rates are high in the period preceding death. Recovery from conditions requiring LTC declines with age; higher recovery rates among the elderly occur at ages 65–74 and lower rates at ages 85+. LTC financing varies substantially between and within countries, and according to the LTC user’s income, assets, and social support networks. This research paper focuses on LTC in the United States.
LTC Surveys
The population using LTC can be defined narrowly based on ADL limitations and more broadly using IADL limitations and/or CI. Variations in operational implementations of each definition can yield vastly different estimates of the size of the population using LTC and its change over time. Wiener et al. (1990) reviewed the measurement of ADL status in 11 national surveys and found that the prevalence of ADL limitations among noninstitutionalized persons in the 1984 National Health Interview Survey Supplement on Aging (NHIS-SOA) was 62% of that in the 1987 National Medical Expenditure Survey (NMES) and 56% of that in the 1984 National Long Term Care Survey (NLTCS).
Freedman et al. (2002) reviewed the quality and consistency of disability trends in seven national surveys and assigned the best ratings to the NLTCS and to a combination of the National Health Interview Survey (NHIS) and the National Nursing Home Survey (NNHS). The NLTCS used a nationally representative stratified list sample of elderly Medicare enrollees aged 65þ years; the NHIS used a complex area-probability sample of the civilian noninstitutionalized population, covering all ages; the NNHS used a stratified two-stage list sample of nursing homes, covering all ages. The combined NHISNNHS sample, in theory, overlaps and extends to all ages the elderly sample of the NLTCS.
Rogers and Komisar (2003) used the combined 2000 NHIS-NNHS to estimate that 9.5 million persons had ADL or IADL limitations, of whom 3.5 million were younger than age 65 and 6.0 million were aged 65+. Manton and Gu (2001) used the 1999 NLTCS to estimate that 7.0 million persons aged 65+ had ADL or IADL limitations. The 1.0 million person difference at age 65þ was the difference between the estimates of the size of the noninstitutionalized LTC population: 4.5 million in the NHIS versus 5.5 million in the NLTCS.
Kinosian (2006) performed detailed comparisons of ADL limitations in the NHIS and NLTCS and found that the 1999 NHIS estimate for noninstitutionalized persons was 72.4% of that in the 1999 NLTCS; in contrast, the 1999 NNHS estimate for institutionalized persons was 99.6% of that in the 1999 NLTCS. Blackwell and Tonthat (2003) reported estimates for noninstitutionalized persons in the 1999 NHIS that were 82.8% of the 1999 NLTCS estimates.
The above comparisons indicate that the estimates of the size of the population using LTC will depend on the source of the data used in making the estimates, even when using data that are judged to be of high quality and reliability. Time differences in the relative sizes of the NHIS and NLTCS estimates can produce trend differences in the rates of change of the sizes of the population using LTC.
NLTCS
The best source for details on the use of LTC in the US is the NLTCS. Its purpose was to measure LTC disability and the use of LTC services among the U.S. elderly aged 65+ at multiple points in time. It included six closely related surveys conducted in 1982, 1984, 1989, 1994, 1999, and 2004. LTC disability included ADL and IADL limitations, cognitive impairment (CI), and institutionalization. The six waves constituted a nationally representative longitudinal sample of 49 274 Medicare enrollees aged 65+. Beginning in 1984, each wave added a replenishment sample of approximately 5000 persons who had passed their 65th birthday since the closing date of the sample drawn for the prior wave. The replenishment sample ensured that each wave contained a representative cross-sectional sample of approximately 20 000 elderly Medicare enrollees. The response rates were generally 95% or higher, except for 2004, which dropped to 91%.
The NLTCS employed a two-stage sampling of Medicare enrollment files. The first stage consisted of a short screener interview to assess the inability of a community resident to perform nine ADLs and seven IADLs without help or to determine that the respondent was a resident of a nursing home or a similar LTC institution. Help meant assistance from another person or special equipment needed to perform the activity. The IADLs were recognized as being limited only when the inability to perform the activity was the result of a disability or health problem. A community resident screened in if the duration of the ADL and/or IADL limitation was expected to be at least 3 months. Institutionalized persons screened in without any additional conditions.
The second stage consisted of a detailed in-person assessment that was given to new and prior screened-in persons, institutionalized persons, and certain supplemental samples of persons who screened out at the first stage assessment. The ADLs and IADLs were modified in the second stage to facilitate the detailed assessment of the nature of the limitations. One ADL was dropped and one was moved to the IADL list, where it was separated into two component activities. These changes yielded seven ADLs and nine IADLs.
The nine IADLs were light housework, laundry, meal preparation, grocery shopping, outside mobility, travel, managing money, taking medication, and making telephone calls. An IADL limitation was recognized only when caused by a disability or health problem. A tenth IADL, heavy housework, was also assessed but was not part of the screener criteria.
The seven ADLs were eating, inside mobility, transferring, dressing, bathing, toileting, and continence. The NLTCS questions allowed the ADL limitations to be classified according to the following hierarchy:
- needs, but does not receive, help with ADL;
- performs ADL with special equipment;
- uses standby help with/without special equipment;
- uses active help with/without special equipment;
- unable to perform ADL.
Questions were also asked about the elapsed (but not expected) duration of the ADL limitations and the frequency of help. Beginning in 1994, questions were asked about whether the help actually received on specific ADLs was enough to meet the respondent’s needs, and if not, the frequency at which such insufficiencies occurred.
Continence was included in the first-stage screener interview and as part of the toileting module in the second-stage detailed interview; however, it did not trigger the toileting ADL nor was it included as part of the standard set of six flap-item ADLs designed to identify disabled persons in the NLTCS.
The NLTCS did not screen for CI in the first stage assessment. The second-stage detailed interviews employed the Short Portable Mental Status Questionnaire (SPMSQ; Pfeiffer, 1975) in 1982–1994 and 2004, and the Mini Mental State Exam (MMSE; Folstein et al., 1975) in 1999. In addition, CI can be inferred when a proxy interview was listed as resulting from senility or Alzheimer’s disease.
Health Insurance Portability And Accountability Act
Clarification of the tax treatment of LTC expenses (including LTC insurance) was included in the Health Insurance Portability and Accountability Act of 1996 (HIPAA). HIPAA introduced rules under which LTC expenses could qualify as income-tax-deductible medical expenses. HIPAA required that a licensed health-care practitioner certify that the LTC care recipient is a chronically ill individual on account of one or more of three possible triggering criteria (Internal Revenue Service, 1977):
- ADL Trigger: The individual is unable to perform without substantial assistance from another individual at least two out of six ADLs (bathing, dressing, toileting, transferring, continence, and eating) for at least 90 days due to a loss of functional capacity. Substantial assistance means hands-on or standby assistance. Hands-on assistance means the physical assistance of another person without which the individual would be unable to perform the ADL. Standby assistance means the presence of another person within arm’s reach that is necessary to prevent injury to the individual while the individual is performing the ADL.
- Cognitive Impairment (CI) Trigger: The individual requires substantial supervision to protect him or her from threats to health and safety due to severe cognitive impairment. Severe cognitive impairment means a loss or deterioration in intellectual capacity comparable to Alzheimer’s disease or similar irreversible dementia with a measurable impact on memory, orientation, or reasoning. Substantial supervision means continual supervision (including cueing) that is necessary for the individual’s health/safety.
- Similar Level Trigger: The individual has a level of disability similar to that described in the ADL Trigger, as determined under regulations developed in consultation with the Department of Health and Human Services (DHHS). This trigger is currently inactive, but may at some future date be activated using, for example, some combination of ADLs and IADLs.
By 2002, 90% of all LTC insurance policies sold in the US complied with the HIPAA requirements for tax qualification (Coronel, 2004). These rules are the de jure criteria for classifying LTC expenses as medical expenses, making it reasonable to consider their use in public health and public policy research.
LTC Disability Estimates
Table 1 displays the population distribution of the HIPAA ADL and CI Triggers by ADL and IADL disability levels among the U.S. elderly in 1999, based on data from the 1999 NLTCS. The cumulative totals at the bottom of the table indicate that 4.75 million elderly met at least one of the two HIPAA triggering criteria: 2.96 million met the ADL Trigger, 3.44 million met the CI Trigger, and 1.65 million met both triggers.
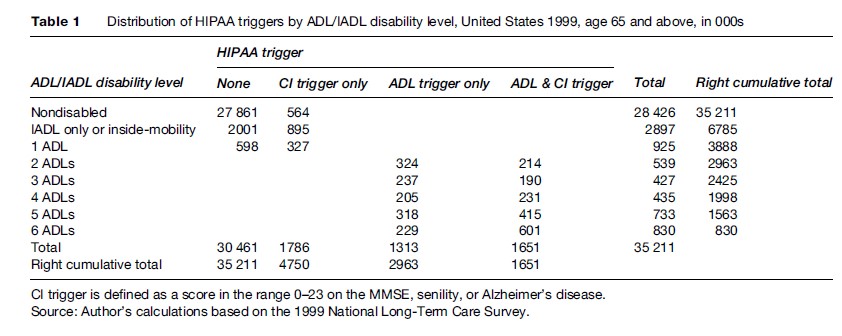
The implementation of the HIPAA ADL Trigger in this research paper followed the standard NLTCS protocol in accepting as ADL-disabled all cases that met the personal assistance criterion for ADL limitations in the detailed questionnaire without further considering whether the expected disability duration would be at least 3 months. Expected 3-month duration was queried on the screener questionnaire, but only for newly screened-in cases; for previously screened-in cases, expected 3-month duration was queried, if at all, at the time they screened in.
Thus, the determination that the expected duration was at least 3 months was incomplete in the NLTCS detailed interview; some cases (e.g., institutionalized persons; the healthy subsamples) were automatically screened in or were otherwise designated for detailed interview without explicitly meeting the expected 3-month duration criterion (Wolf et al., 2005).
The standard NLTCS protocol may have a small bias when used to estimate HIPAA ADL prevalence rates. Among the reasons for this opinion are the following:
- The HIPAA ADL prevalence rate based on two or more ADL impairments in the NLTCS detailed questionnaire would be approximately 15% lower if one eliminated all cases whose disability duration was less than 3 months (Stallard and Yee, 2000). Multiple decrement analysis of these same cases showed that the relative risks of ending the disability episode with institutionalization or death versus recovery or improvement were 1.3 at ages 68 and 70, 2.3 at age 75, 2.9 at age 80, 4.8 at age 85, and 6.3 or higher at ages 90 and over. With the highest absolute numbers of cases that met the two or more ADL impairment criteria occurring at age 81, these relative risks imply that roughly one-quarter of the 15% reduction in prevalence that would result from the elimination of cases with less than 3 months’ duration of disability would be due to recovery or improvement. Hence, the bias induced by failing to screen for expected 3month duration could be as large as 3.75%.
- The 3-month minimum duration in the HIPAA ADL Trigger is neither a waiting period nor a qualification period; it is an expectation that may or may not be realized. HIPAA certifiers might assume that the age-specific average durations for two or more ADL disability episodes (in the range 36–26 months at ages 65–90) (Stallard and Yee, 2000) applied to each individual case, implying that the bias associated with the standard NLTCS protocol could be zero.
- Alternatively, HIPAA certifiers might rely on model-based (or expert-opinion-based) estimates of the expected individual durations, in which case the bias would be non-zero only if the durations from initial disability to recovery/improvement were predictable and the model (or expert) yielded at least some predicted durations below 3 months; the bias would reach the upper limit of 3.75% only if the model reproduced the distribution of durations without error. Under these conditions, the bias associated with the use of the standard NLTCS protocol is likely to be substantially less than the upper limit of 3.75%.
The estimates for the CI Trigger depend on the scoring range selected for the MMSE. An individual with an MMSE score in the range of 0–23 of a possible 30 points was classified as cognitively impaired in Table 1. An alternative classification would use the range 0–15. The upper bounds of 23 and 15 correspond to the midpoints of the ranges for mild (21–25) and moderate (11–20) dementia identified by Perneczky et al. (2006) using the Clinical Dementia Rating instrument. The impact of the alternative classification rule can be seen in Table 2.
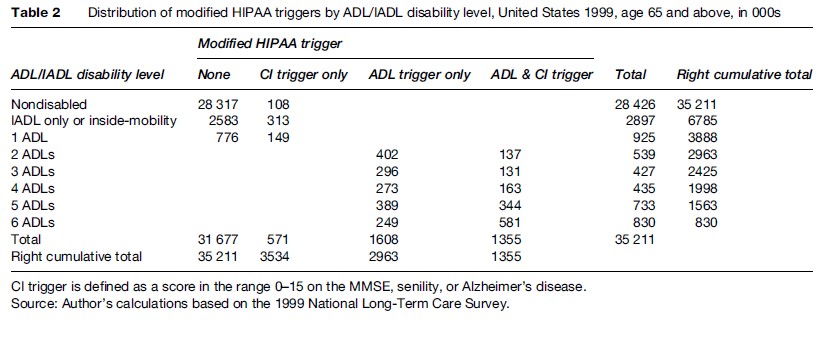
The number of persons meeting only the CI Trigger declined from 1.79 million to 571 000. The total number meeting the CI Trigger declined from 3.44 million to 1.93 million. The number meeting the ADL Trigger was unchanged at 2.96 million. The number meeting at least one of the triggers declined from 4.75 million to 3.53 million.
Although the HIPAA CI Trigger uses the terms severe cognitive impairment with a measurable impact, HIPAA did not provide guidance as to the specific cut-points one should use for standard tests such as the MMSE. As a consequence, there may be substantial variation in estimates of the size of the LTC population when different tests of cognitive functioning or different cut-points on the same tests are employed. The remainder of this research paper employs the criteria in Table 1.
The cumulative totals at the right side of Table 1 show the distribution of the 2.96 million persons who met the HIPAA ADL Trigger. Of these, 2.00 million had four or more ADL limitations and 830 000 had six ADL limitations; and, of these, 62% and 72%, respectively, were also cognitively impaired.
The number of persons with any ADL or IADL limitation, including limitations in inside mobility, was estimated as 6.79 million. The number of nondisabled persons meeting the CI Trigger was 564 000 (108 000 in Table 2). Since the NLTCS did not screen for CI, this may be an underestimate of the true number. Thus the total number with any CI, ADL, or IADL limitation was at least 7.35 million.
An area of potential discrepancy in estimating the LTC population involves differences between the list of ADLs in HIPAA and the list used in the NLTCS flap items, which forms the set traditionally used in published reports based on the NLTCS (Manton and Gu, 2001).
Five of the six HIPAA ADLs are the same as the traditional six flap-item ADLs in the NLTCS. HIPAA’s ADLs include continence, but not inside mobility. The flap-item ADLs include inside mobility, but not continence. Because continence was measured in the NLTCS, the NLTCS can be used to generate estimates of the population meeting the HIPAA LTC criteria in addition to estimates of the population meeting the traditional NLTCS disability criteria. The former are shown in Tables 1 and 2; the latter are shown in Table 3.
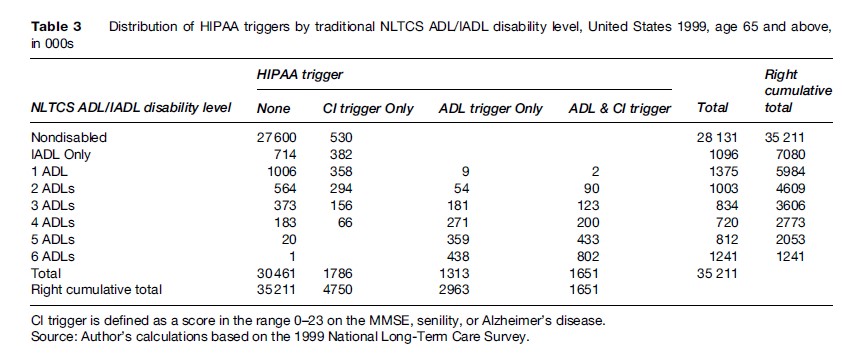
The flap-item ADLs in the NLTCS are triggered by the use of special equipment in addition to the use of personal assistance. The largest difference occurs under the column heading None, where 1.14 million persons having two or more flap-item ADLs are classified as not disabled by the HIPAA LTC triggers. The total number of 7.08 million with any ADL or IADL limitations is only 4.3% higher than the corresponding number (6.79 million) in Table 1. The 4.61 million with two or more ADLs in Table 3 is 56% larger than the corresponding number (2.96 million) in Table 1.
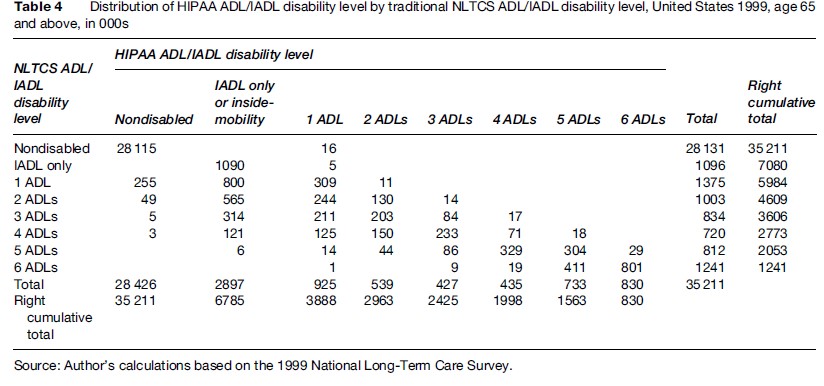
Table 4 provides a direct comparison between the two sets of classification rules. The 16 000 with one HIPAA ADL that were nondisabled on the traditional flap-item ADLs and IADLs were all due to incontinence.
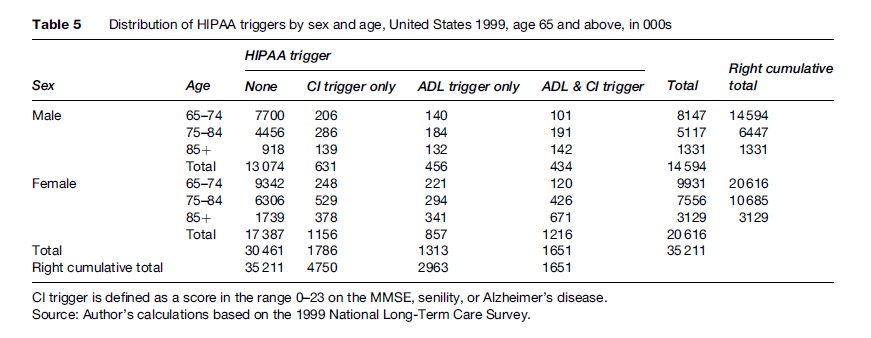
LTC Demographics
Among males, 434 000 met both the ADL and CI Triggers, with the largest number of those aged 75–84. Among females, 1.22 million met both the ADL and CI Triggers, with the largest number of those aged 85+. Among the 6.1% of males who met the ADL Trigger, 49% simultaneously met the CI Trigger; among the 10% of females who met the ADL Trigger, 59% simultaneously met the CI Trigger.
Certain patterns of change over age can be more readily assessed using the percentage distributions shown in Table 6. For example, the relative frequency of ADL Trigger cases meeting the CI Trigger increased with age for both sexes, but the increase was larger for females.
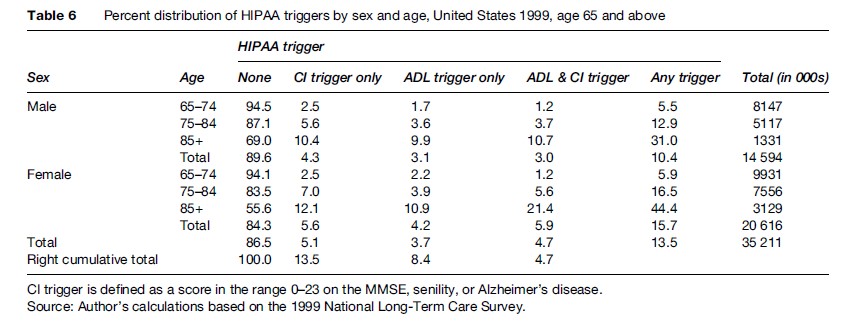
Moreover, the percentage of females meeting any HIPAA trigger was larger at all ages for females and the relative excess increased with age from 8.1% at age 65–74 to 43% at age 85+. This latter increase was attributable to the absolute excess of 10.7% of females at age 85+ meeting both the ADL and CI Triggers.
Tables 7 and 8 stratify the population counts and percentage distributions in Tables 5 and 6 by community residence versus residence in an LTC institution, where an LTC institution was a nursing facility or similar setting having a health professional (e.g., registered nurse, licensed practical nurse, licensed vocational nurse, psychiatrist, etc.) on duty for 24 h each day (including weekends).
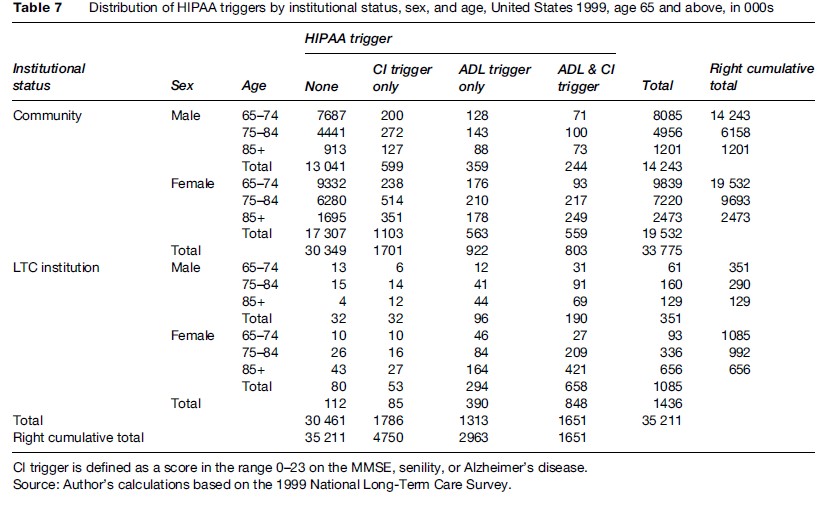
The age–sex group with the largest number of institutional residents was females aged 85+ with 656 000 of the total 1.44 million. The next largest group was females aged 75–84, followed by males aged 75–84.
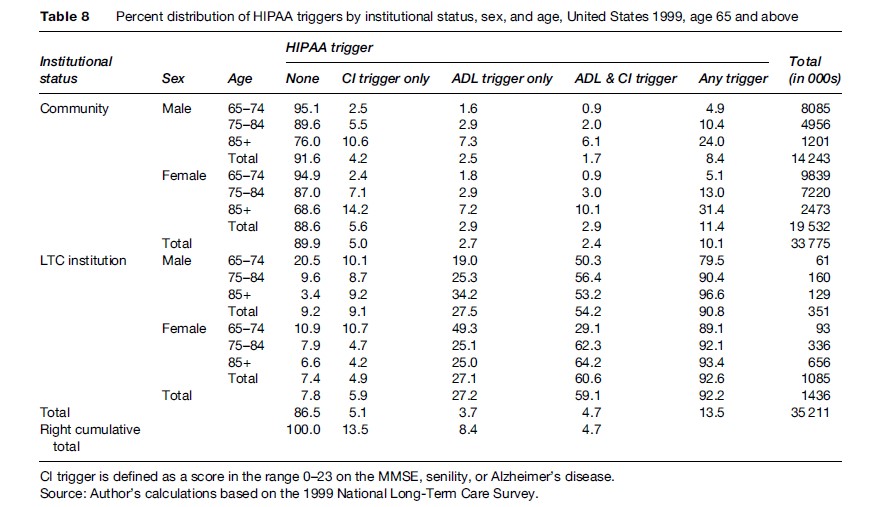
Among institutional residents, 92% met at least one HIPAA LTC trigger, the only notable discrepancy occurring among males aged 65–74, where 80% met at least one trigger. For females aged 65–74, the corresponding value was 89%. For both sexes, the value increased with age, reaching 97% for males aged 85+ and 93% for females aged 85+. These results indicate that the HIPAA LTC triggers were reasonably successful (i.e., their overall sensitivity was 92%) in meeting their goal of identifying severely disabled elderly persons, assuming that residence in an LTC institution was a valid indicator of severe disability.
Meeting a HIPPA LTC trigger, however, does not necessarily imply institutional residency. Table 9 displays the age, sex, and HIPAA LTC-Trigger-specific institutionalization rates for the data displayed in Table 7.

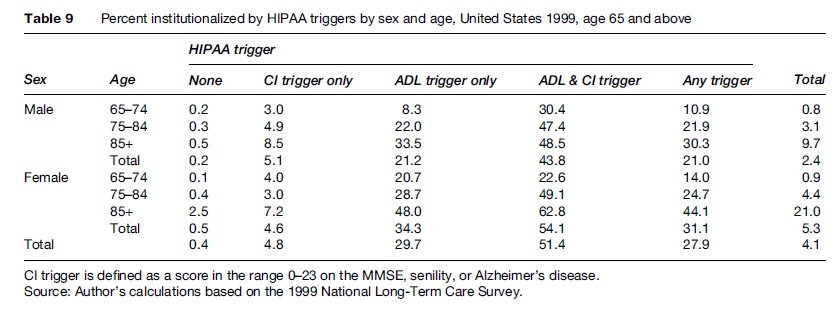
Among those meeting any HIPAA LTC trigger, 31% of females and 21% of males (28% combined) were institutionalized.
The institutionalization rates varied significantly depending on the specific triggers that were met. Among those meeting both the ADL and CI Triggers, 54% of females and 44% of males (51% combined) were institutionalized; among those meeting only the ADL Trigger, 34% of females and 21% of males (30% combined) were institutionalized; and among those meeting only the CI Trigger, 4.6% of females and 5.1% of males (4.8% combined) were institutionalized.
The overall institutionalization rates were 5.3% for females and 2.4% for males (4.1% combined); these rates increased significantly across the three age groups, from 0.8% to 9.7% for males and 0.9% to 21% for females. Within the HIPAA LTC triggered groups, the highest institutionalization rate (63%) was for females aged 85+ meeting both the ADL and CI Triggers; the next highest rate (49%) was for females aged 75–84 meeting the same triggers.
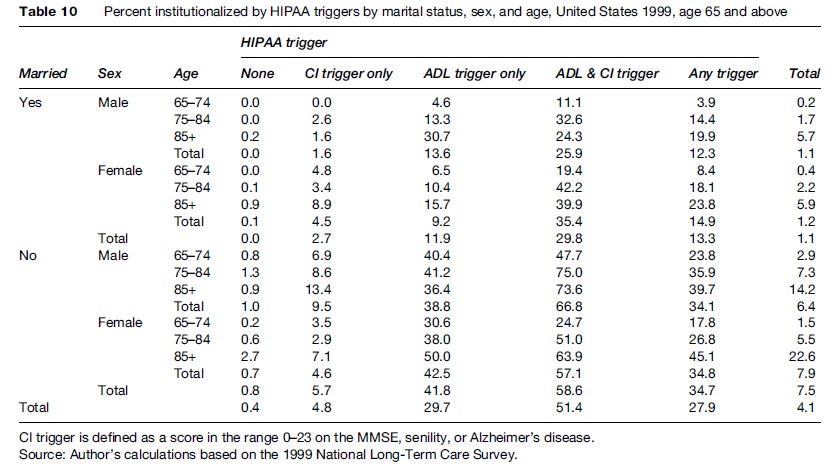
Table 10 stratifies the institutionalization rates in Table 9 by marital status. Among those meeting any HIPAA LTC trigger, 15% of married females and 12% of married males (13% combined) were institutionalized. For the same conditions, 35% of unmarried females and 34% of unmarried males (35% combined) were institutionalized. Among those meeting both the ADL and CI Triggers, 35% of married females and 26% of married males (30% combined) were institutionalized. For the same conditions, 57% of unmarried females and 67% of unmarried males (59% combined) were institutionalized. The highest rates of institutionalization were among unmarried males aged 75–84 (75%) and 85+ (74%) meeting both the ADL and CI Triggers.
Home And Community-Based LTC
Table 11 displays the usage rates among community residents of personal assistance within the week prior to the NLTCS detailed interview, where the assistance stemmed from a disability or health problem and details of the nature and amount of the assistance were provided.
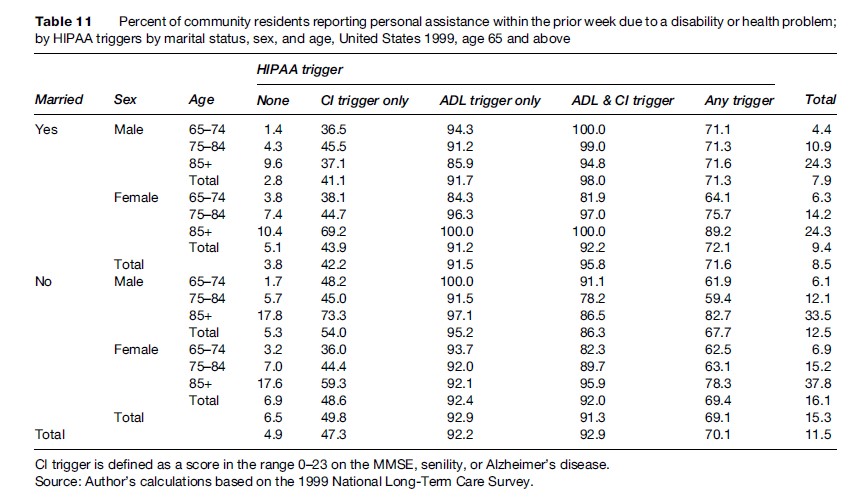
The personal assistance rates were very low for persons who met neither HIPAA LTC trigger: 3.8% of married persons and 6.5% of unmarried persons (4.9% combined) had such assistance; unmarried females had the highest rates of assistance (6.9%) and married males the lowest (2.8%).
The specificity of the HIPAA LTC triggers can be estimated as the percentage of persons among the estimated 29.88 million community residents meeting neither HIPAA LTC trigger who had no personal assistance due to a disability or health problem within the prior week, assuming that the lack of such assistance was a valid indicator of the absence of severe disability. The number of such persons was 28.85 million, implying a specificity of 97%.
In contrast, personal assistance rates were substantial for persons meeting any HIPAA LTC trigger: 72% of married persons and 69% of unmarried persons (70% combined) had such assistance; married females had the highest rates of assistance (72%) and unmarried males the lowest (68%).
The highest personal assistance rates were for persons meeting both the ADL and CI Triggers: 96% of married persons and 91% of unmarried persons (93% combined) had such assistance; married males had the highest rates of assistance (98%) and unmarried males the lowest (86%). The assistance rates for females meeting both the ADL and CI Triggers were the same (92%) for married and unmarried women.
The personal assistance rates were almost as high for persons meeting only the ADL Trigger: 92% of married persons and 93% of unmarried persons (92% combined) had such assistance; unmarried males had the highest rates of assistance (95%) and married females the lowest (91%).
The personal assistance rates were substantially lower for persons meeting only the CI Trigger: 42% of married persons and 50% of unmarried persons (47% combined) had such assistance; unmarried males had the highest rates of assistance (54%) and married males the lowest (41%). These declines suggest that the current implementation of the CI Trigger may overestimate the number of cases that meet the HIPAA certification requirements. However, because the modified CI Trigger used in Table 2 would only raise the marginal percentage in Table 11 from 47% to 55%, it follows that the use of more stringent MMSE scoring criteria would not resolve the overestimation.
The relatively low frequency of personal assistance among those meeting only the basic or modified CI Triggers was attributable to subgroups of persons identified in Tables 1 and 2 as CI Trigger Only who were free from IADL and ADL limitations and whose marginal rates of personal assistance were only 8.4% and 6.6%, respectively, for the two forms of the CI Triggers. Among married persons meeting these same criteria, the rates of personal assistance were similarly low at 6.3% and 6.6%, respectively. These calculations suggest that some forms of assistance provided to persons meeting only the CI Trigger may not be captured by the NLTCS survey instruments.
Eliminating the CI Trigger Only persons who were free from IADL and ADL limitations would raise the marginal percentages among those meeting only the basic or modified CI Triggers to 67% and 68%, respectively. The marginal percentages would increase further to 79% and 80%, respectively, if the IADL-only groups were eliminated (leaving a residual group with exactly 1 ADL limitation). These calculations indicate that ADL and IADL assistance provided to persons meeting only the CI Trigger is captured by the survey instruments.
Table 12 displays the percentages using paid personal assistance among community residents with any personal assistance within the week prior to the NLTCS detailed interview. The numerators of the percentages in Table 11 were the denominators of the percentages in Table 12.
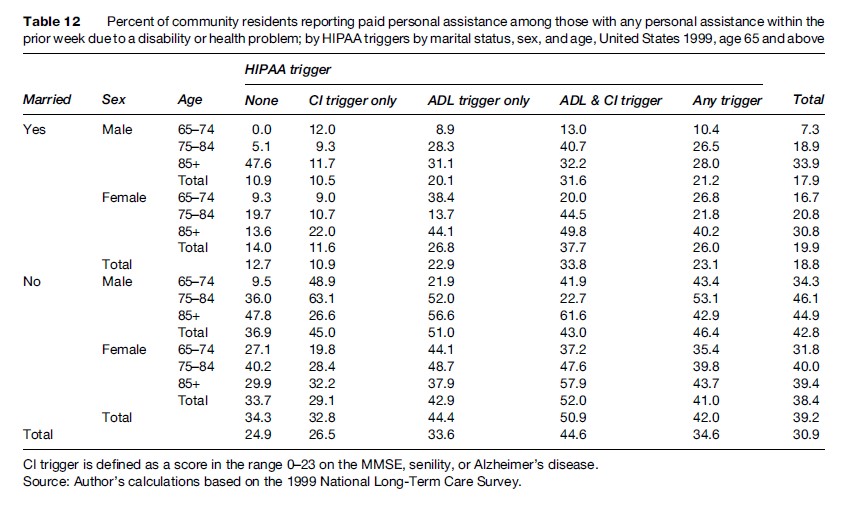
The use of paid personal assistance was substantial for persons who met neither HIPAA LTC trigger but who had personal assistance: 13% of married persons and 34% of unmarried persons (25% combined) had paid assistance; unmarried males had the highest rates of paid assistance (37%) and married males the lowest (11%). Of course, these percentages would be reduced substantially if one multiplied them by the corresponding values in Table 11 to produce the marginal usage rate of paid personal assistance among all persons who met neither HIPAA LTC trigger.
The use of paid personal assistance was 8–10% higher, absolutely, for persons who met any HIPAA LTC trigger: 23% of married persons and 42% of unmarried persons (35% combined) had paid assistance; unmarried males had the highest rates of paid assistance (46%) and married males the lowest (21%).
The use of paid personal assistance was an additional 9–11% higher for persons who met both the ADL and CI Triggers: 34% of married persons and 51% of unmarried persons (45% combined) had paid assistance; unmarried females had the highest rates of paid assistance (52%) and married males the lowest (32%).
The use of paid personal assistance for persons who met only the ADL Trigger was similar to the use for those who met any HIPAA LTC trigger: 23% of married persons and 44% of unmarried persons (34% combined) had paid assistance; unmarried males had the highest rates of paid assistance (51%) and married males the lowest (20%).
The use of paid personal assistance for persons who met only the CI Trigger was substantially lower than for persons who met the HIPAA ADL trigger, and was close to the use for persons who met neither HIPAA LTC trigger: 11% of married persons and 33% of unmarried persons (27% combined) had paid assistance; unmarried males had the highest rates of paid assistance (45%) and married males the lowest (11%).
Table 13 displays the average number of hours of help per week among community residents reporting personal assistance within the week prior to the NLTCS detailed interview. The numerators of the percentages in Table 11 were the denominators of the averages in Table 13.
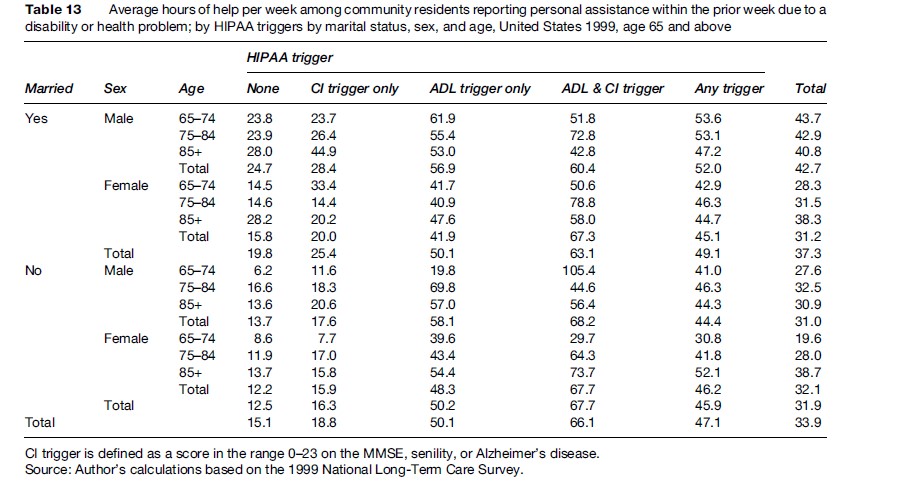
Hours of help were missing for about 8% of the respondents in the numerators of Table 13; these missing values were assumed to be equal to the cell-specific means for the nonmissing values. The weekly hours of help were substantial for persons who met neither HIPAA LTC trigger but who had personal assistance: Married persons had an average of 20 h and unmarried persons an average of 13 h (combined average was 15 h); married males had the highest average (25 h) and unmarried females the lowest (12 h). These averages would be reduced substantially if one multiplied them by the corresponding values in Table 11 to produce the marginal hours of help among all persons who met neither HIPAA LTC trigger.
The weekly hours of help were substantially higher for persons who met any HIPAA LTC trigger: Married persons had an average of 49 h and unmarried persons an average of 46 h (combined average was 47 h); married males had the highest average (52 h) and unmarried males the lowest (44 h).
The weekly hours of help were highest for persons who met both the ADL and CI Triggers: Married persons had an average of 63 h and unmarried persons an average of 68 h (combined average was 66 h).
Among those meeting only the ADL Trigger, married and unmarried persons both had an average of 50 h. Among those meeting only the CI Trigger, married persons had an average of 25 h and unmarried persons an average of 16 h (combined average was 19 h).
Table 14 displays the average number of paid hours of help per week among community residents reporting paid personal assistance within the week prior to the NLTCS detailed interview. The numerators of the percentages in Table 12 were the denominators of the averages in Table 14.
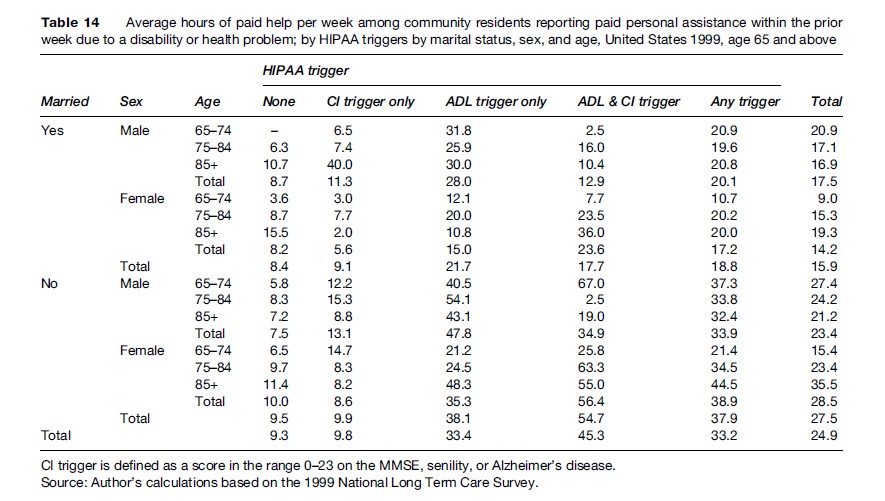
Hours of help were missing for about 4% of the respondents in the numerators of Table 14; these missing values were assumed to be equal to the cell-specific means for the nonmissing values.
The weekly hours of paid help were lowest for persons who met neither HIPAA LTC trigger but who had paid personal assistance: Married persons had an average of 8 h and unmarried persons an average of 10 h (combined average was 9 h); unmarried females had the highest average (10 h) and married females the lowest (8 h).
The weekly hours of paid help were substantially higher for persons who met any HIPAA LTC trigger: Married persons had an average of 19 h and unmarried persons an average of 38 h (combined average was 33 h); unmarried females had the highest average (39 h) and married females the lowest (17 h).
The weekly hours of paid help were similar or higher for persons who met both the ADL and CI Triggers: Married persons had a similar average of 18 paid h and unmarried persons a higher average of 55 paid h (combined average was 45 paid h).
Among those meeting only the ADL Trigger, married persons had an average of 22 paid h and unmarried persons an average of 38 paid h (combined average was 33 paid h). Among those meeting only the CI Trigger, married persons had an average of 9 paid h and unmarried persons an average of 10 paid h (combined average was 10 paid h).
Disability Declines
One of the most significant findings from the NLTCS was the discovery (Manton et al., 1993, 1997) and confirmation (Manton and Gu, 2001; Freedman et al., 2002, 2004) that LTC disability rates among the U.S. elderly were declining at a rate faster than the 0.6% per year expected based on the century-long trends established by Fogel and Costa (1997) and Costa (2000, 2002).
Stallard et al. (2004) used longitudinal weights to establish that the general decline in disability also applied to the more severe form represented by the HIPAA ADL Trigger. Longitudinal weights were used because concerns had been raised about the reliability of the standard cross-sectional weighting procedures in the NLTCS (Freedman et al., 2004).
The standard cross-sectional weighting procedures used the CDS Screener Cross-Sectional Weights for each indicated year, with adjustment for noncomplete institutional interviews. The longitudinal weights were defined as the cross-sectional weights assigned to the NLTCS respondents in 1984 or, if not then, the first cross-sectional weights assigned to the respondents as they aged in at some later date. The longitudinal weights did not include adjustments for non-response, in part because the response rates to the survey were very high (about 95%), and in part to minimize the number of assumptions used in their construction. However, the longitudinal weights included a one-time adjustment for deletions of certain persons aged 70–74 at their second survey, which reverted to the original longitudinal weights when these persons were reinstated beginning at their third survey. All of these deleted persons screened out at their first survey when they were aged 65–69. The surveys affected by these deletions were conducted in 1989, 1994, and 1999. The deletions were made because the vast majority of these persons were free of disabilities and the limited resources had to be directed toward the disabled.
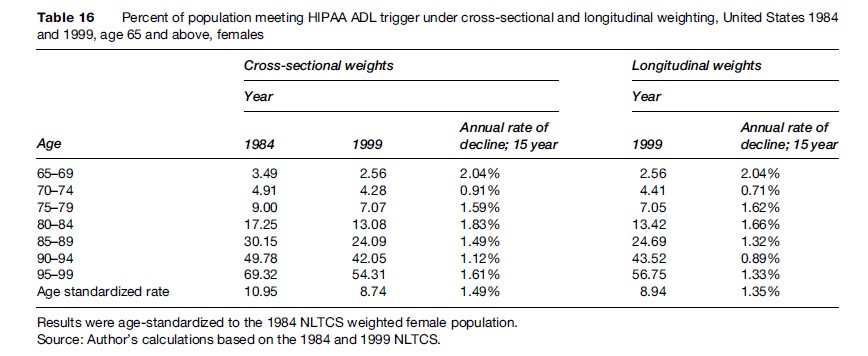
Tables 15 and 16 display separately by sex the age-specific and age-standardized disability prevalence rates and their changes based on the HIPAA ADL Trigger using the standard cross-sectional weights for 1984 and 1999 and the longitudinal weights for 1999.
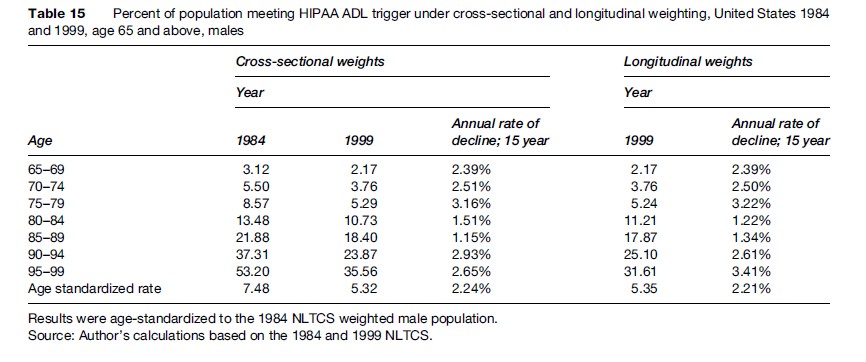
For both sets of weights, for all ages, and for both sexes, the prevalence rates for persons meeting the HIPAA ADL Trigger declined at rates faster than the expected rate of0.6% per year. The age-standardized rates declined at a rate of 2.2% per year for males (for both sets of weights) and 1.4% or 1.5% per year for females (longitudinal vs. cross-sectional weights).
Significant areas of research involve the development and fielding of improved instruments for measurement of LTC disability and the analysis of existing data to enhance our understanding of the causes and public health implications of the declines.
Bibliography:
- Actuarial Standards Board (1999) Long-Term Care Insurance. Actuarial Standard of Practice No. 18. Washington DC: Actuarial Standards Board.
- Blackwell DL and Tonthat L (2003) Summary Health Statistics for the US Population: National Health Interview Survey, 1999. Vital and Health Statistics Series 10, No. 211. Hyattsville, MD: National Center for Health Statistics.
- Coronel S (2004) Long-Term Care Insurance in 2002. Washington DC: America’s Health Insurance Plans.
- Costa DL (2000) Understanding the twentieth-century decline in chronic conditions among older men. Demography 37(1): 53–72.
- Costa DL (2002) Changing chronic disease rates and long-term declines in functional limitations among older men. Demography 39(1): 119–137.
- Fogel RW and Costa DL (1997) A theory of technophysio evolution, with some implications for forecasting population, health care costs, and pension costs. Demography 34(1): 49–66.
- Folstein MF, Folstein SE, and McHugh PR (1975) Mini-mental state: A practical method for grading the cognitive state of patients for the clinician. Journal of Psychiatric Research 12: 189–198.
- Freedman VA, Martin LG, and Schoeni RF (2002) Recent trends in disability and functioning among older adults in the United States. Journal of the American Medical Association 288(24): 3137–3146.
- Freedman VA, Crimmins E, Schoeni RF, et al. (2004) Resolving inconsistencies in old-age disability trends: Report from a technical working group. Demography 41(3): 417–441.
- Internal Revenue Service (1977) IRS Notice 97–31, Bulletin No. 1997–21, Internal Revenue Service, May 27, 1977. pp. 5–8.
- Kinosian B (2006) The Department of Veterans Affairs Long-Term Care Planning Model and the National Long-Term Care Survey. Philadelphia, PA: Department of Veterans Affairs.
- Manton KG and Gu X (2001) Changes in the prevalence of chronic disability in the United States black and nonblack population above age 65 from 1982 to 1999. Proceedings of the National Academy of Sciences USA 98(11): 6354–6359.
- Manton KG, Corder LS, and Stallard E (1993) Estimates of change in chronic disability and institutional incidence and prevalence rates in the US elderly population from the 1982, 1984, and 1989 National Long Term Care Survey. Journal of Gerontology: Social Sciences 48(4): S153–S166.
- Manton KG, Corder LS, and Stallard E (1997) Chronic disability trends in elderly United States populations 1982–1994. Proceedings of the National Academy of Sciences USA 94: 2593–2598.
- Perneczky R, Wagenpfeil S, Komossa T, Grimmer T, Diehl J, and Kurz A (2006) Mapping scores onto stages: Mini-Mental State Examination and Clinical Dementia Rating. American Journal of Geriatric Psychiatry 14(2): 139–144.
- Pfeiffer E (1975) A short portable mental status questionnaire for the assessment of organic brain deficit in elderly patients. Journal of the American Geriatrics Society 23: 433–441.
- Rogers S and Komisar H (2003) Who Needs Long-Term Care. Georgetown University Long-Term Care Financing Project. Washington DC: Georgetown University.
- Stallard E and Yee RK (2000) Non-Insured Home and Community-Based Long-Term Care Incidence and Continuance Tables. Actuarial Report. Schaumburg, IL: Long-Term Care Experience Committee Society of Actuaries.
- Stallard E, Wolf RM, and Weltz SA (2004) Morbidity improvement and its impact on LTC insurance pricing and valuation. The Record 30(1): Session #107PD, Society of Actuaries.
- Wiener JM, Hanley RJ, Clark RJ, and Van Nostrand JF (1990) Measuring the activities of daily living: Comparisons across national surveys. Journal of Gerontology: Social Sciences 45(6): 229–237.
- Wolf DA, Hunt K, and Knickman J (2005) Perspectives on the recent decline in disability at older ages. The Milbank Quarterly 83(3): 365–395.
See also:
Free research papers are not written to satisfy your specific instructions. You can use our professional writing services to buy a custom research paper on any topic and get your high quality paper at affordable price.
ORDER HIGH QUALITY CUSTOM PAPER

Always on-time

Plagiarism-Free

100% Confidentiality


