
This sample Dynamical Simulation In Criminology Research Paper is published for educational and informational purposes only. If you need help writing your assignment, please use our research paper writing service and buy a paper on any topic at affordable price. Also check our tips on how to write a research paper, see the lists of criminal justice research paper topics, and browse research paper examples.
Overview
Simulation techniques from the area of Artificial Intelligence can be beneficial for the field of Criminology because they can be used to gain more insights in criminological phenomena (that were not clear based on just the informal theory), without actually having to experiment with these phenomena in the real world. The main goal of this research paper is to explain the process of modelling and simulation step by step and to illustrate the benefits of this approach for the field of Criminology.
Introduction
Within the field of Criminology a number of standard research methods exist to study criminal behavior, e.g., victim surveys, offender surveys, social experiments, and the analysis of police data. Based on these methods multiple theories have been developed that provide insight into delinquent behavior. However, these theories are usually “informal,” meaning that they are written in natural language or described graphically and, thus, in principle ambiguous. In contrast, researchers from the areas of Computer Science and Artificial Intelligence have recently started investigating whether theories from Criminology can be translated into a formal, unambiguous, machine-readable notation, so that they can be used for simulation (e.g., Gerritsen 2010; Liu and Eck 2008; Malleson and Brantingham 2009). The main assumption behind that work is that simulation techniques can be beneficial, because they can be used to gain more insights in criminological phenomena (that were not clear based on just the informal theory), without actually having to experiment with these phenomena in the real world. The main goal of this research paper is to explain the process of modelling and simulation step by step and to illustrate the benefits of this approach for the field of Criminology.
Modelling And Simulation
The main concept involved in the area of modelling and simulation is the concept of a model. A model is a representation of an object, system, or idea in some form other than that of the entity itself (Shannon 1975). Such a representation describes the most important concepts and their relations. However, it is almost never possible to describe all these aspects completely and unambiguously, e.g., because the exact relation between concepts in reality is not known or because not all factors that influence a concept are known. When building such a model it is important to realize that this has some important consequences:
- A model is a simplification, not a complete representation of the reality.
- A model is based on several choices and assumptions of the creator of the model.
- Characteristics of the model are not necessarily characteristics of reality.
These consequences should be taken into account when working with models, as they imply that the conclusions that are drawn based on the model are based on the assumptions that are made.
In general, the main goal of a model is usually that it enables the user to study a certain process that exists in reality in a convenient manner. There may be several possible reasons why studying a model is more convenient than studying the process itself. One possible reason is that the process of interest does not yet exist. An example of such a situation is studying the impact of the introduction of surveillance cameras in a mall on people’s behavior. Another reason can be that the process itself cannot be easily studied directly. For example, think about cognitive processes: it is not easy to measure things that go on in a human mind, while one can analyze relatively easily how a model of it behaves. In such a situation, a model may provide the researcher more insight in the process under investigation, even if it is not completely identical to the real world. One other common reason for studying models instead of the process in reality is prediction: one would like to see what happens in the future. Economical and weather models are examples of models that are often used for prediction, but also the prediction of the development of crime rates in a city is a possibility. Finally, experimenting using a model can be cheaper and more feasible than experimenting with real processes. For example, experimenting with different surveillance strategies is much more convenient in a simulated world than in the real world (Bosse and Gerritsen 2010).
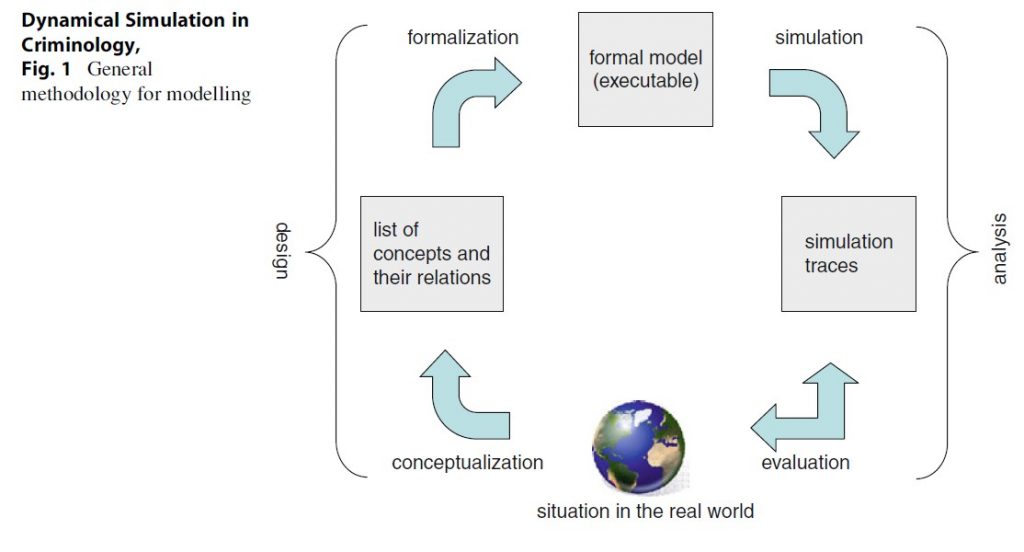 Dynamical Simulation in Criminology, Fig. 1 General methodology for modelling
In order to study a model, it is often useful if the model can imitate the dynamics of the process over time. This process is called simulation, and models that can be used to simulate behavior over time are called dynamical models. This type of model is the focus of this research paper. A simulation model imitates the dynamics of a process over time and thus helps to clarify the interaction between different aspects. The result of a simulation is a sequence of states of the model at subsequent time points, which is called a trace, simulation trace, or simulation run. The outcomes of a simulation are usually represented in a graphical form.
Modelling And Simulation Cycle
A general methodology for designing and analyzing models, the modelling and simulation cycle, is depicted in Fig. 1.
The modelling cycle consists of two main phases that comprise four steps. The first phase is the design phase in which the model is built. This phase consists of the conceptualization and the formalization of a process. The second phase is the phase in which the model is analyzed. This phase consists of the simulation of the process and the evaluation of the model. Below these four steps of the process are explained in more detail.
Conceptualization
Before starting the conceptualization, it is important to decide what exactly should be modelled. This means that it should be decided which process should be simulated and which questions need to be answered by using the model.
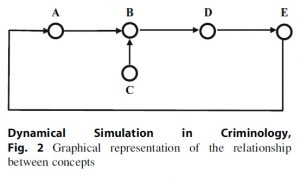 Dynamical Simulation in Criminology, Fig. 2 Graphical representation of the relationship between concepts
Then, there are two relevant aspects that need to be distinguished in the conceptualization step.
First, the relevant concepts need to be identified. What are the factors that play a role in a process? A concept can be an object but it can also be an event. Which concepts are important depends on the process that is modelled.
The second task is the specification of the relationships between the concepts that have been identified. At this moment it is specified whether different concepts influence each other, but not yet how they influence each other. This is specified in detail in the formalization step. The results of specifying the relationships between concepts can be a list of statements in the form of “A affects B,” where it is possible that concepts are influenced by multiple concepts. It is also an option to represent these relationships in a graph. Each concept should be depicted as a node (circle) and the relationships as edges (arrows) between the nodes (see Fig. 2).
Formalization
In the formalization step, the concepts and relations between concepts specified in the conceptualization step are defined in more detail. The formalization depends on the representation mechanism that is used for the model. When considering existing simulation approaches, the following two classes can be identified (Bosse et al. 2007): logic-oriented approaches and mathematical approaches, usually based on difference or differential equations. Logic-oriented approaches are good for expressing qualitative relations but less suitable for working with quantitative relationships. Mathematical approaches are good for the quantitative relations, but expressing conceptual, qualitative relationships with them is hard to impossible. These representations will also be used in the case study presented in the next section. The exact form of the formalization (i.e., the formula’s chosen) is a choice made by the modeller, based on the assumed form of relations between concepts. A number of standard ways of specifying relations are available to the modeller (e.g., logistic growth, weighted average).
Simulation Experiments
Depending on the representation of the model and the software tools used, it is possible to simulate the model and generate a simulation trace. To perform a simulation experiment a number of steps have to be taken. First the question or the pattern to be addressed by the experiment is formulated, for example, to investigate the amount of crime that is performed in a certain period. As a next step, choices have to be made with respect to the initial values of variables and the values of the parameters involved in the simulation model. Setting up a simulation experiment requires a structured plan on which values are chosen for these variables and parameters, thereby establishing a particular scenario. The settings of these values are determined by the process under investigation. If one is simulating the dynamics of crime over a city and the precise locations of the different houses are known, then this information can be used to set the parameters that represent the locations of the houses in the simulation. Alternatively, it is also possible to set parameters by using fictive information. Moreover, different scenarios can be used in order to compare the outcomes for different circumstances: changing the values in a number of different simulations. For a thorough evaluation, multiple scenarios need to be simulated.
Some models contain a stochastic element, i.e., parameters for which the values are determined by a probability. With this kind of models, running the same model several times results in possibly different traces, which all reflect the outcome of a different simulation for the same model.
Evaluation
Evaluation consists of verifying whether the model is a correct representation of the system that it represents. This can be done by formulating certain properties that hold in the actual situation and check whether they also hold in the model. These properties often express higher-level characteristics of the behavior of the process rather than the direct influences, for example, stable end situations (e.g., if all environmental factors are stable eventually also the amount of crimes will stabilize), or the effect of the occurrence of several events at the same time.
A distinction can be made between two types of properties:
- Quantitative properties: statements about numerical characteristics of a model. Examples of quantitative properties are “the crime numbers never decline with more than 10 percent” or “the amount of burglaries increases with 5 percent each year.”
- Qualitative properties: statements about nonnumerical relations or characteristics of the model. Examples of qualitative properties are “eventually state property X will be true” (e.g., an offender will be arrested), “event A always occurs before event B,” “parameter X (e.g., the crime rate) is always decreasing,” “the simulation always reaches an equilibrium,” etc.
Various computer programs exist that automatically check properties of a simulation model.
When the evaluation shows that the model does not resemble the real process well enough, there may be three possible causes, namely, (1) a modelling flaw, (2) wrongly chosen values for the parameters that describe the influence of the concepts on each other, or (3) an invalid theory that was used as a basis. In the first case, the modelling cycle has to be continued with a reconceptualization phase. In the second case, better values for parameters have to be chosen. This can be done heuristically, by trying different values that result in a more realistic simulation or by mathematical approaches that find optimal parameter values. This latter mechanism is called parameter tuning. To apply parameter tuning, realistic data about the simulated process are required. The tuning process then finds parameter values that, when used in the model, achieve results that are as close as possible to the empirical data. In the third case (i.e., there is a discrepancy between the theory used as a basis for the model and the phenomena observed in the real world), the model can be used as a tool to find out in more detail where the theory is incorrect (e.g., by comparing simulation results with empirical data). The result of this step is usually that the theory itself is altered or refined.
When the evaluation gives a satisfactory result, the validated model can be used as tool for studying the process that has been described. Different hypothetical scenarios can be simulated and compared to improve the understanding of the process or evaluate the effect of changes in the scenario.
Case Study: Simulation And Analysis Of The Dynamics Of Hot Spots
In this section the modelling and simulation cycle is applied to a concrete example: the spatiotemporal dynamics of crime, more particular the emergence of the so-called criminal hot spots. This is one of the main research interests within Criminology. Hot spots are places where many crimes occur (Sherman et al. 1989). After a while the criminal activities shift to another location, for example, because the police has changed its policy and increased the number of officers at the hot spot. Another reason may be that the passersby move away when a certain location gets a bad reputation. The reputation of specific locations in a city is an important factor in the spatiotemporal distribution and dynamics of crime (Herbert 1982). For example, it may be expected that the amount of assaults that take place at a certain location affects the reputation of this location. Similarly, the reputation of a location affects the attractiveness of that location for certain types of individuals. For instance, a location that is known for its high crime rates will attract police officers, whereas most citizens will be more likely to avoid it. As a result, the amount of criminal activity at such a location will decrease, which will affect its reputation again. Below, it is explained how the spatiotemporal dynamics of crime can be modelled by referring to the interaction of three groups, namely, offenders, guardians, and passersby (i.e., potential victims). This case study is inspired by the research presented in Bosse et al. (2011).
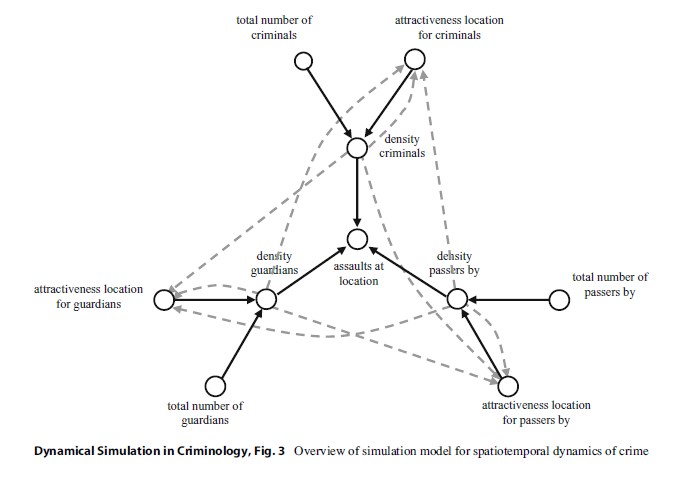 Dynamical Simulation in Criminology, Fig. 3 Overview of simulation model for spatiotemporal dynamics of crime
Conceptualization
In order to make a simulation model of the spatiotemporal dynamics of crime, several aspects are important. First, it is important to know the total number of the different groups involved, i.e., the number of offenders, number of guardians, and number of passersby. Next, it is assumed that the world (or city) that is addressed can be represented in terms of a number of different locations. It is important to know how many individuals (or agents) of each type are present at each location: the density of offenders, density of guardians, and density of passersby. Furthermore, to describe the movement of the different agents from one location to another, information about the reputation (or attractiveness) of the locations is used, so also this information is needed. This attractiveness is different for each type of agent. For example, passersby like locations where it is safe, e.g., locations where many guardians are present and no offenders. On the other hand, guardians are attracted by places where a lot of offenders are present, and offenders like locations where there are many passersby and no guardians. Finally, to be able to represent the idea of hot spots (locations where many crime takes place), the number of assaults per location is modelled. The idea is that more assaults take place at locations where there are many offenders and passersby and few guardians, cf. the Routine Activity Theory by (Cohen and Felson 1979).
The dynamic relationships are visualized in Fig. 3. To enhance clarity, the relationships that affect attractiveness of locations are depicted as gray dashed lines.
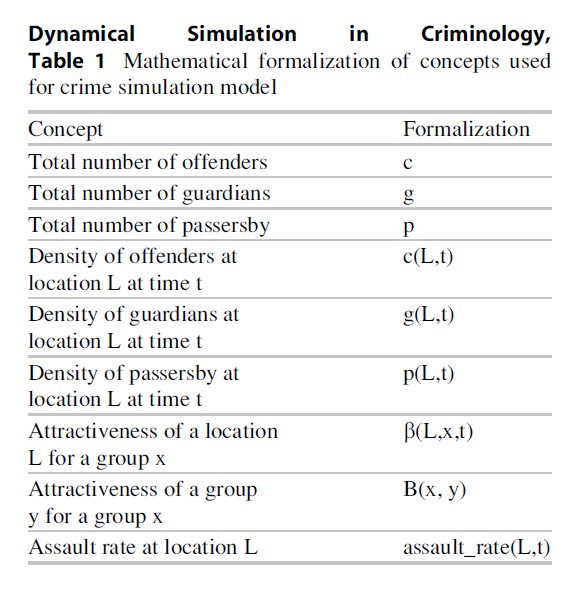 Dynamical Simulation in Criminology, Table 1 Mathematical formalization of concepts used for crime simulation model
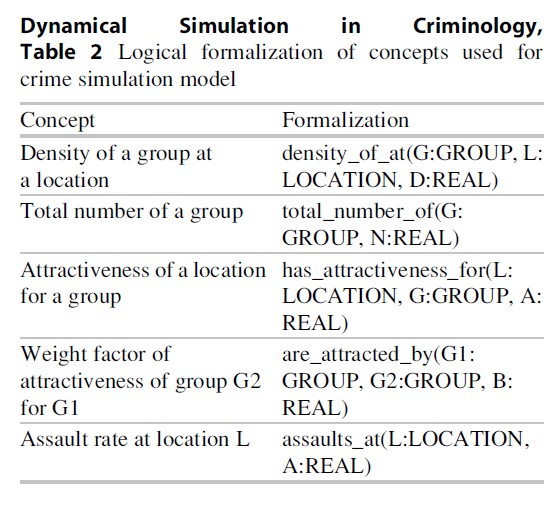 Dynamical Simulation in Criminology, Table 2 Logical formalization of concepts used for crime simulation model
Formalization
In this section, as a next step, for each of the concepts introduced in the previous section, both a mathematical and a logical formalization (a logical atom) are introduced; see Tables 1 and 2. Note that these two forms of representation are presented purely as illustrations of the difference of logical and mathematical modelling, but both are formalizations of the same model.
Note that the first three concepts of Table 1 do not contain an argument t for time, since the values of these concepts remain constant over time.
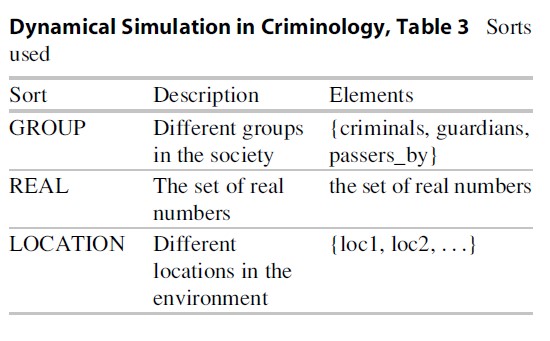 Dynamical Simulation in Criminology, Table 3 Sorts used
Here, the variables A and B in the two attractiveness predicates are assumed to range over the interval [0, 1]. Note that some logical atoms make use of the so-called sorts (i.e., limited sets of elements that belong to a certain group, similar to types in programming languages). The specific sorts that are used in the presented model, and the elements that they contain, are shown in Table 3. Moreover, note that the attractiveness of certain groups for other groups is not shown in Fig. 3.
The dynamic relationships between these concepts are formalized below, both as mathematical formulae and as logical relationships. The first relationship determines how attractive each location is for the different groups (where it is assumed that B11+B12+B13=1):
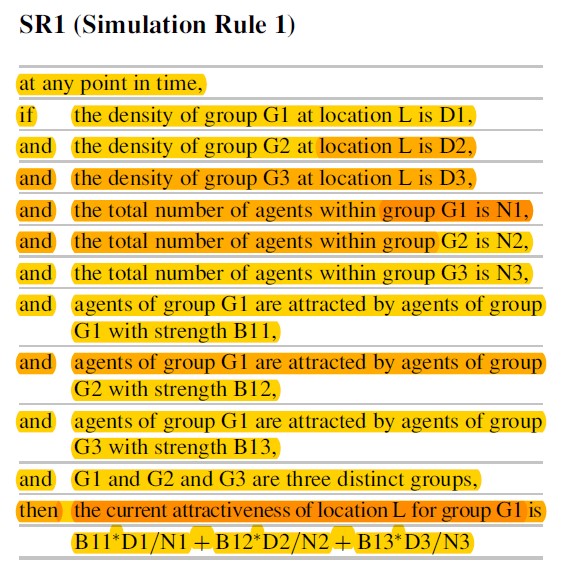
Table 3.1 SR1 (Simulation Rule 1)
Mathematical formalization:
 Formula 1

Logical formalization (note that the first line indicates the sorts to which the variables belong):
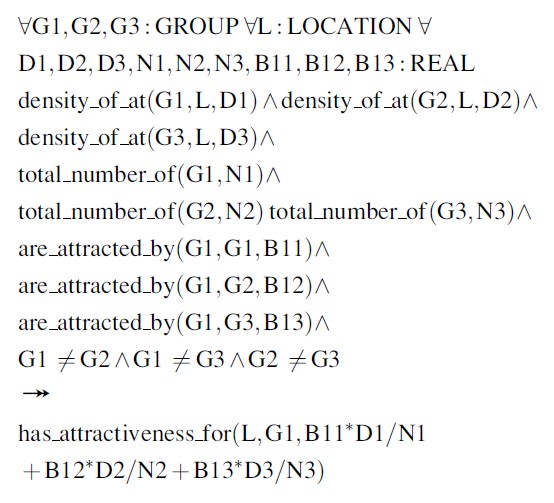 Formula 2
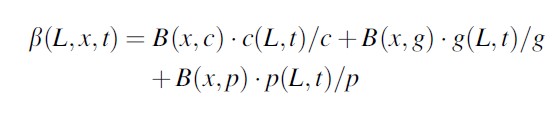
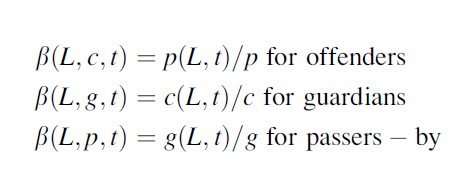
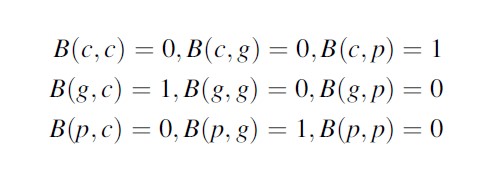
This formula expresses that the attractiveness of a location is based on some kind of reputation of the location for the respective types of agents. This reputation is calculated as a linear combination of the densities of all agents. Several variants of a reputation concept can be used. The only constraint is that they are assumed to be normalized such that the total over the locations equals 1. For example, a natural parameter setting for offenders would be to have B(c,p) high since offenders need victims to assault, and to have B(c,g) low because offenders try to avoid guardians. For the guardians, B(g,c) is likely to be high since offenders attract guardians, whereas B(g,p) is rather high as well. Finally, for the passersby the B(p,c) can be taken low as passersby prefer not to meet offenders, and B(p,g) (and possibly also B(p,p)) high because guardians (and other passersby) protect the passersby.
Based on this attractiveness function, the movement of the different types of agents between the locations can be determined:
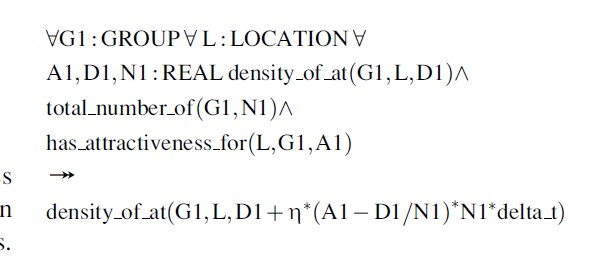
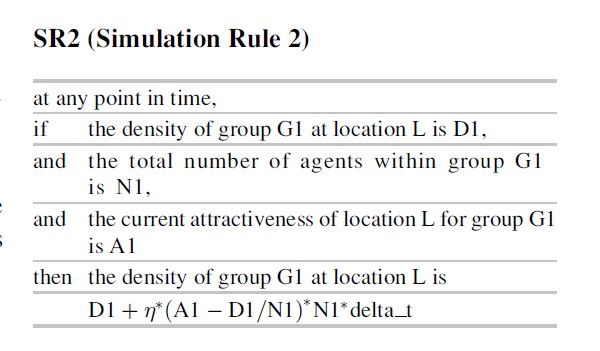 Table 3.2 SR2 (Simulation Rule 2)
Mathematical formalization:
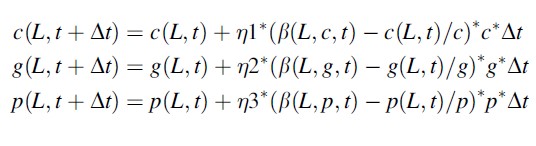 Formula 3
Logical formalization:
 Formula 4
Here, the formula for offenders expresses that the density (ΔL,t+Δt) of offenders at location L on t + Δt is equal to the density of offenders at the location at time t plus a constant (expressing the rate at which offenders move per time unit) times the movement of offenders from t to t + Δt from and to location L multiplied by Δt. Here, the movement of offenders is calculated by determining the relative attractiveness β(L, c, t) of the location (compared to the other locations) for offenders. From this, the density of offenders at the location at time t divided by the total number c of offenders (which is constant) is subtracted, and the result is multiplied with c, resulting in the change of the number of offenders for this location. For the guardians and the passersby similar formulae are used.
In order to measure the assaults that take place per time unit, also different variants of formulae can be used, for example:
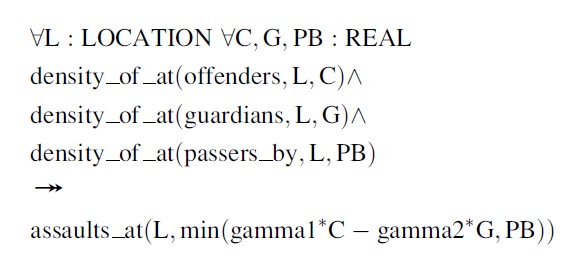
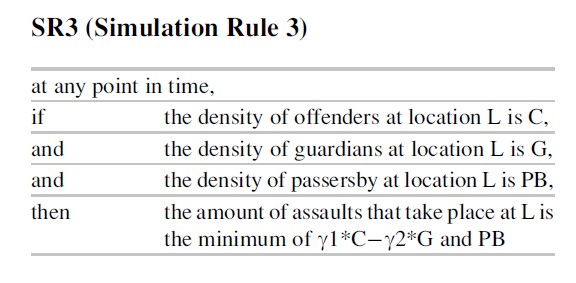 Table 3.3 SR3 (Simulation Rule 3)
Mathematical formalization:
 Formula 5
Logical formalization:
 Formula 6
Here, the assault rate at a location at time t is calculated as the minimum of the possible assaults that can take place and the number of passersby. Here the possible number of assaults is the capacity per time step of offenders (g1) multiplied by the number of offenders at the location minus the capacity of guardians to avoid an assault (g2) times the number of guardians. In theory this can become less than 0 (the guardians can have a higher capacity to stop assaults than the offenders have to commit them), therefore the maximum can be taken of 0 and the outcome described above.
Simulation
This section presents an example simulation trace that was generated on the basis of the simulation model for the spatiotemporal dynamics of crime. The parameter settings used for the simulation are presented in Table 4. As shown there, the simulation comprises four locations (L1, L2, L3, and L4), 800 offenders, 400 guardians, and 4,000 passersby. The initial distribution of these agents over the four locations is shown in Table 5.
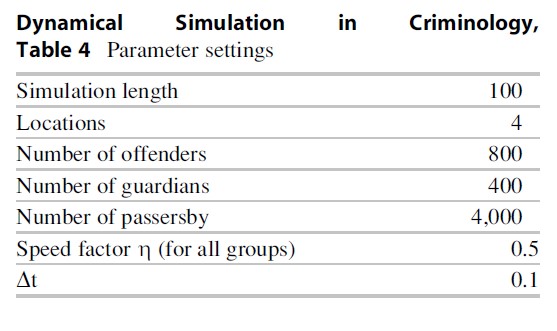 Dynamical Simulation in Criminology, Table 4 Parameter settings
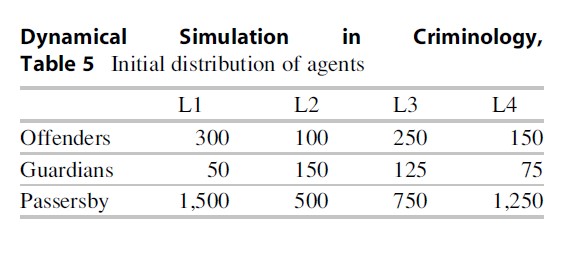 Dynamical Simulation in Criminology, Table 5 Initial distribution of agents
For the attractiveness function (SR1), the following formulae have been used:
 Formula 7
Note that this corresponds to the following settings for the different B(x,y):
 Formula 8
Obviously, more complex attractiveness functions can be used as well.
A simulation trace for this situation is depicted in Fig. 4. Note that this simulation has been performed in the MATLAB simulation environment. The first three graphs depict the movement of, respectively, offenders, guardians, and passersby over the different locations. The last graph depicts the amount of assaults performed.
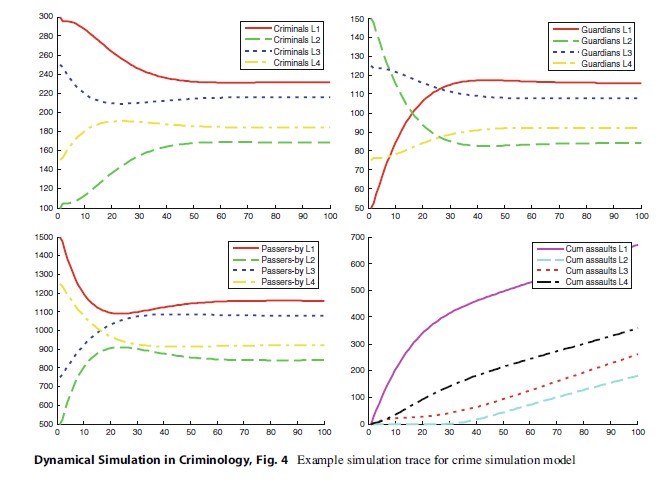 Dynamical Simulation in Criminology, Fig. 4 Example simulation trace for crime simulation model
As shown in Fig. 4, from the beginning of the simulation many passersby move away from location 1 (where there are many offenders and few guardians) and towards location 2 (where there are many guardians and few offenders). The guardians follow the opposite pattern: they move away from location 2 and towards location 1. As soon as the number of guardians at location 1 has increased, this location becomes more attractive for the passersby. The offenders first move away from location 1, towards location 2, but as soon as the passersby come back to location 1, a significant part of the offenders stays there. Eventually, all populations stabilize.
Although this is just one example simulation trace, it illustrates the power of simulation to study criminological processes. The way the simulation model has been set up enables the researcher to full in any desired combination of parameter settings, thereby reproducing (an artificial instance of) a particular real-world situation of interest. For example, one can manipulate the number of locations, the ratio between the different types of agents, or the attractiveness functions. By running simulations for these different settings, one can gain more insight in how the corresponding scenarios might develop in reality.
Evaluation
As shown, the model presented in the previous sections is capable of producing very interesting patterns. For example, eventually the number of offenders, guardians, and passersby on each location stabilizes. Nevertheless, as yet no guarantee has been given that these patterns are realistic. In other words, the model has not been validated (with empirical data). In order to fully validate a model, an obvious approach is to compare the output of the model with empirical data. For the presented case study, ideally this would mean that one would compare for each time point of the simulation whether the numbers of offenders, assaults, and so on would match the numbers if the process would take place in reality. However, for obvious reasons, such a detailed comparison is not always feasible. Moreover, it is even not always necessary, since the results of a simulation model that is not fully validated can still provide interesting insights to the researcher (as long as one is confident that the basic mechanisms of the model are plausible). For this reason, sometimes a more modest form of validation can be performed. For example, it is possible to specify higher-level requirements about the behavior of the model. These requirements might result from knowledge by domain experts. For example, if it is known from empirical data that hot spots never move if the characteristics of the locations stay the same, the following property might be formulated. This property expresses, in a semiformal notation, that after a certain time point t, the densities of all three groups stay around a certain equilibrium:
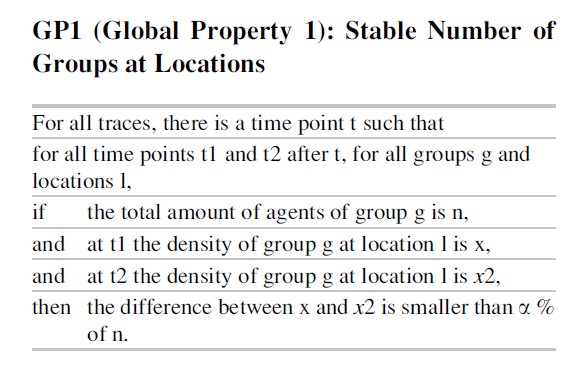 Table 5.1 GP1 (Global Property 1): Stable Number of Groups at Locations
Using an automated tool for checking properties of simulation runs (Bosse et al. 2009b), property GP1 has been checked against the trace shown in Fig. 4. It was found, among others, that for an a of 1.0 (i.e., 1 %), stabilization of offenders occurs at time point 35, stabilization of guardians occurs at time point 28, and stabilization of passersby occurs at time point 38. Assuming that one would have similar information about a corresponding real-world process (e.g., one would know for a given scenario how long it takes until each group stabilizes), then a comparison of these numbers can be used to confirm that the model shows plausible behavior.
Also other types of properties can be specified. Some examples are the following (only in informal notation):
- “for each group, the attractiveness of each location is always between 0 and 1” (checking this property can be useful for the modeller to check whether the model is free of errors that make the variables go out of their ranges).
- “between time points t1 and t2, the density of group g at location l is monotonically increasing/decreasing.”
- “for all traces y1 and y2, if there are more locations in y1 than in y2, then at the end of the simulation there will be less crime in y1.” Thus, checking certain properties allows the modeller to investigate whether the model behaves according to the expectations. Note that it is part of an iterative process: when the model does not behave according to the expectations, you return to the first step of the modelling and simulation cycle (conceptualization), in order to improve and refine its basic mechanisms.
Discussion
Within the area of Criminology, analysis of complex social and environmental processes, such as the spatiotemporal dynamics of crime, is an important challenge. For instance, criminologists are interested in the question where criminal hot spot may emerge and when they will emerge. Answering such questions is not easy since the large number of factors involved can make the process quite complicated. Moreover, it is often not feasible to perform experiments with these processes in the real world. The use of computer simulation can be a solution to this problem. Computer simulation may help to investigate complex (spatiotemporal) processes within criminology in a relatively fast and cheap manner.
In this research paper, the different methodological steps involved in modelling and simulation have been explained, and the methodology has been illustrated for a particular case study. Note that the main goal of the case study is to help researchers in their theory building, to shed more light on the process under investigation. As such, the presented model can be used as an analytical tool to see how certain aspects influence the spatiotemporal dynamics of crime. This tool can for example be used to investigate a fictive process, e.g., how do passersby, guardians, and offenders react to each other when their ratio is 4:1:2? And what happens when the number of guardians is increased?
As soon as the model can be shown to be sufficiently realistic (i.e., the global patterns produced by the model match reality), it may also become of interest for policy makers, e.g., to study certain “what-if” scenarios. For example, one may investigate how the crime level of a certain city will change if the policy makers invest in more surveillance in a certain area (Bosse et al. 2010b). Other interesting insights from simulation models in the criminological domain are the finding that anticipating strategies for police investments seem to be more effective than reactive strategies (Bosse et al. 2010b); the finding that school and parents have a relatively large influence on delinquent behavior among juveniles (Bosse et al. 2009a); and that for a reasonable amount of guardians, hot spot policing seems to be more effective on the crime rates than area hot spot policing (Bosse et al. 2010).
When one considers the level of detail of similar tools that have been proposed in the literature (such as Baal 2004; Brantingham et al. 2005; Groff 2005; Liu et al. 2005; Melo et al. 2005; Reis et al. 2006), it turns out that different perspectives are taken. For example, some authors have attempted to develop simulation models of crime displacement in existing cities, which can be directly related to real-world data (e.g., Liu et al. 2005), whereas others deliberately abstract from empirical information (e.g., Bosse et al. 2010). The point of view taken in the current article can be situated in between these two extremes. Initially, the simulation model was developed to study the spatiotemporal dynamics of crime per se. However, its basic concepts have been defined in such a way that they can be directly connected to empirical information, if this becomes available. As a result, an interesting challenge for future work will be to explore the possibilities to connect the basic concepts of the model to real-world data.
Bibliography:
- Baal PHM van (2004) Computer simulations of criminal deterrence: from public policy to local interaction to individual behaviour. Ph.D. Thesis, Erasmus University Rotterdam, Boom Juridische Uitgevers
- Bosse T, Gerritsen C (2010) An agent-based framework to support crime prevention. In: Hoek W van der, Kaminka GA, Lespe´rance Y, Luck M, Sen S (eds) Proceedings of the ninth international conference on autonomous agents and multi-agent systems, AAMAS’10. ACM Press, pp 525–532
- Bosse T, Jonker CM, van der Meij L, Treur J (2007) A language and environment for analysis of dynamics by simulation. Int J Artif Intell Tools 16(3):435–464
- Bosse T, Gerritsen C, Klein MCA (2009a) Agent-based simulation of social learning in criminology. In: Sharp B (ed) Proceedings of the international conference on agents and artificial intelligence, ICAART’09. INSTICC Press, pp 5–13
- Bosse T, Jonker CM, van der Meij L, Sharpanskykh A, Treur J (2009b) Specification and verification of dynamics in agent models. Int J Coop Inf Syst 18:167–193
- Bosse T, Elffers H, Gerritsen C (2010) Simulating the dynamical interaction of offenders, targets and guardians. Crime Patterns Anal 3(1):51–66
- Bosse T, Gerritsen C, Hoogendoorn M, Jaffry SW, Treur J (2011) Agent-based versus population-based simulation of displacement of crime: a comparative study. Web intelligence and agent systems: an international journal, IOS Press, to appear
- Brantingham PL, Gl€asser U, Singh K, Vajihollahi M (2005) Mastermind: modeling and simulation of criminal activity in urban environments. Technical report SFU-CMPTTR-2005–01. Simon Fraser University
- Cohen LE, Felson M (1979) Social change and crime rate trends; a routine activity approach. Am Sociol Rev 44:588–608
- Gerritsen C (2010) Caught in the act: investigating crime by agent-based simulation. Ph.D. Thesis. VU University Amsterdam
- Groff ER (2005) The geography of juvenile crime place trajectories. Ph.D. Thesis. University of Maryland
- Herbert DT (1982) The geography of urban crime. Longman, Harlow
- Liu L, Eck J (eds) (2008) Artificial crime analysis systems: using computer simulations and geographic information systems. Hershey, PA
- Liu L, Wang X, Eck J, Liang J (2005) Simulating crime events and crime patterns in RA/CA model. In: Wang F (ed) Geographic information systems and crime analysis. Idea Group, Singapore, pp 197–213
- Malleson N, Brantingham P (2009) Prototype burglary simulations for crime reduction and forecasting. J Int Symp Environ Criminol Crime Anal 2(1):47–66
- Melo A, Belchior M, Furtado V (2005) Analyzing police patrol routes by simulating the physical reorganisation of agents. In: Sichman JS, Antunes L (eds) Multiagent-based simulation VI, proceedings of the sixth international workshop on multi-agent-based simulation, MABS’05. Lecture notes in artificial intelligence, vol 3891. Springer Verlag, 2006, pp 99–114
- Reis D, Melo A, Coelho ALV, Furtado V (2006) Towards optimal police patrol routes with genetic algorithms. In: Mehrotra S, et al. (eds) ISI 2006. LNCS 3975, pp 485–491
- Shannon RF (1975) Systems simulation. Prentice-Hall
- Sherman LW, Gartin PR, Buerger ME (1989) Hot spots of predatory crime: routine activities and the criminology of place. Criminology 27:27–55
See also:
Free research papers are not written to satisfy your specific instructions. You can use our professional writing services to buy a custom research paper on any topic and get your high quality paper at affordable price.
ORDER HIGH QUALITY CUSTOM PAPER

Always on-time

Plagiarism-Free

100% Confidentiality
