
This sample Forecasting Of Shootings Using Risk Terrain Modeling Research Paper is published for educational and informational purposes only. If you need help writing your assignment, please use our research paper writing service and buy a paper on any topic at affordable price. Also check our tips on how to write a research paper, see the lists of criminal justice research paper topics, and browse research paper examples.
Overview
This research paper summarizes approaches that have been used to study patterns of shootings and empirically examines the environmental conditions that contribute to the emergence of these events. Geographic information systems (GIS) allow for the mapping of spatial influence which refers to the way in which correlates of crime, as features of a landscape, affect places throughout the landscape. Rather than just a feature’s presence, its influence on space is important because context affects criminal behavior. Operationalizing the spatial influence of crime correlates allows analysts to move beyond just creating maps of points that coexist with crime to creating visual narratives of how settings become conducive to crime. This research paper presents ways in which to operationalize criminogenic features of gun shootings to a geographic map. Then it presents the utility of this mapping technique for crime analysis through the use of risk terrain modeling (RTM) to produce a map of compounded criminogenic contexts for shootings in Irvington, NJ. RTM builds upon underlying principles of environmental criminology and problem-oriented policing to articulate and communicate criminogenic and vulnerable areas at the micro-level. By using theoretically grounded operationalizations of spatial influence from many correlates of gun shootings, the paper demonstrates how place-based risk analysis can be achieved by the application of some intuitively simple principles within the analytical reach of crime analysts using basic GIS software.
Introduction
At a time when overall crime rates have dropped, gun shootings continue to plague inner city areas tied to the illegal activity around gangs and drugs. Shootings are often seen as a sign of extreme disorder, occurring when offenders are at their most brazen and law enforcement at its least effective. Shootings are often used as indicators of crime sprees or uncontrollable gangs, and each event attracts special attention from the media. Shootings attract a lot of attention at the political level as well, prompting calls for special policing interventions to stop the violence. A well-known example of this is the multicity program “Operation Ceasefire” that has concentrated on reducing gun violence through a variety of initiatives, including arrest, assistance to offenders from criminal justice agencies, and active involvement in crime reduction by the affected community (for a complete review of these initiatives, see Koflas et al. 2011). Despite all of this attention, or perhaps because of the singular ferocity of the crime event, shootings are often considered in ways that focus more on the specific incident and not as much on the situational factors that might support and contribute to this violent outcome at certain locations. Academic research is beginning to turn more attention to these contextual affects. This research paper summarizes approaches that have been used to study patterns of shootings and examines the environmental conditions that contribute to the emergence or disappearance of these events. The paper begins with an overview of the literature on place and crime and then turns to a discussion of spatial influence of place-based features on criminal outcomes, particularly gun shootings. It concludes with an example of a cartographic method for operationalizing spatial influence and then presents a composite model of place-based risk of shootings in Irvington, New Jersey.
State Of The Art: Current Knowledge On The Concentration Of Shootings
When considering gun shootings, questions have been raised about the extent to which this crime is, in fact, situational and nonrandom. Ratcliffe and Rengert (2008) make the case for the importance that previous shootings play in leading to near repeats – crimes that happen close to and soon after a previous similar incident: This research is modeled after similar studies on burglary. Ratcliffe and Rengert report that there is an elevated risk of about 30 % that a shooting will occur within 2 weeks and within one block of a previous incident. They suggest that these findings show shootings to be influenced by coercion, retaliation, and escalation of violence. So, the characteristics of the interaction between offender and victim will lead to an elevation in the likelihood of shootings in the vicinity of past events. But, why do the initial incidents happen where they do and are there similarities in the types of places that incidents occur? That is, are there environmental (i.e., contextual) factors that bring these crimes together at similar places?
Criminological research about the concentration of crime primarily focuses on spatial clusters or hot spots of crime – where there is a relatively high frequency of similar criminal behaviors at specific places. Foremost research by Sherman et al. (1989) studied the locations of requests for police assistance in the city of Minneapolis over a 1-year period. Spelman and Eck (1989) found that while 10 % of victims in the United States were involved in 40 % of victimization, 10 % of offenders were involved in 50 % of crime, and 10 % of places were involved in 60 % of crimes. More recently, Eck and Weisburd (1995), Johnson (2010), Johnson et al. (2008), Bowers et al. (2004), Braga and Weisburd (2010), and others reported similar clustering effects. Caplan (2011), for instance, reported that less than 1 % of the area of Irvington, New Jersey, accounted for more than 53 % of all shooting incident locations. In Houston, Texas, Wells et al. (2011) found gun assaults to cluster both temporally and spatially.
These findings related to hot spots and near repeats are important and address key situational aspects of violent crime. They provide evidence that these crimes connect to one another by being close to one another. However, they do not address the question of how these crimes, especially the initial instigator events, are influenced by the underlying conditions of the environment. Can one establish that there are spatial patterns that appear in these behaviors that are not just a function of individual decisions to be violent but are a function of underlying environmental factors that concentrate violent acts at specific locations? More simply, why do shootings happen in some places and not in others? This question leads one to consider how to use spatial analysis techniques to connect violent behavior to what Patricia and Paul Brantingham referred to as an environmental backcloth: a combination of qualities or characteristics of places that raises the risk of crime occurrence (Brantingham & Brantingham 1995). According to the Brantinghams, crime generators create settings that are conducive to particular types of criminal acts by creating particular times and places that provide appropriate concentrations of people and other targets. Their combined effects can heighten the risk of crime. The Brantinghams suggest that offenders find targets at these locations that are unlikely to be adequately protected through surveillance or policing. The high levels of crime that occur at certain places, then, come from people at these locations taking advantage of opportunities afforded them through placement of targets. The Brantinghams’ conceptualization of crime generators was recently studied in detail by Bernasco and Block (2010) looking at robberies in Chicago. They indicate that certain features of the environment have a great influence on where crime locates. As a result, robberies, for instance, are not evenly distributed across the urban landscape but concentrate around generators. Similarly, Moreto et al. (2011) found that residential burglaries occur at micro-level places with risky environmental features and that near repeat burglary incidents were even more likely to occur at higher risk places than their instigator events. Studies such as these provide evidence that analyzing the risk heterogeneity of an area is especially useful for developing more complete understandings of crime problems. They also stress the reality that underlying (risky) environmental contexts are often present before either instigator or near repeat incidents.
It is clear from existing research that certain environments have characteristics that encourage or discourage the occurrence of shootings and, therefore, raise or lower criminogenic risk. Shootings tend to be spatially distributed according to the distributions of underlying generators, such as drug markets, or certain features of a landscape, such as bars, clubs, fast-food restaurants, or liquor stores; gang members; bus stops; schools; or public housing. Assigning risk levels to places with certain features of environments, such as these, requires an understanding (i.e., through past empirical research) of their relative importance in supporting shootings. The risk posed by each criminogenic feature throughout a landscape, as well as their confluence at the same place, contributes to a risk value that, when raised a set amount, increases the likelihood of shooting incidents. This risk value – a measure of the clustering of criminogenic factors – can be used to anticipate where shootings will occur and (possibly) cluster over a period of time. Stated another way, risk values are a measure of a place’s vulnerability to crime.
People can live in vulnerable areas defined by an agreed-upon set of criminogenic features, but in the absence of motivated offenders, the existent risk of crime may be relatively low. Crime risks are both place-based and situational – affected by exposure to individual events that appear from location to location and by exposure to places where events cluster over time. It is important to build models of the environmental backcloth that consider different features of the landscape for different crime types because factors that influence the occurrence of one type of crime are likely to differ from those that are associated with other crime types. Cartographically modeling vulnerability as the clustering of risk factors, and then interpreting vulnerability in the context of exposure, permits a research strategy to identify, monitor, and control these environments.
Spatial Influence: The Future Of Mapping Risk Factors
Opportunities for crime are not equally distributed across places, or “small micro-units of analysis” (Weisburd 2008, p. 2), and so the analytical approach to studying criminogenic places plays a critical role in the reliability and validity of efforts to assess vulnerabilities and future crime hot spots. Crime control and prevention activities must consider not only who is involved in the criminal events “but also the nature of the environments in which these activities take place” (Kennedy and Van Brunschot 2009, p. 129) because opportunity for crime is an attribute of all places. Risk assessment, defined by Kennedy and Van Brunschot (2009, p. 4) as “a consideration of the probabilities of particular outcomes,” provides an efficient way to analyze crime opportunities. However, challenges appear in the operationalization of risk in a GIS. The way that criminogenic features have been modeled in a GIS is often contrary to how people experience and conceptualize their environments (Couclelis 1992; Frank and Mark 1991).
When assessing the risk of crime to occur at conceivably any location throughout a landscape, the use of finite points, lines, and polygons in a GIS is a poor representation of criminogenic features on a map because they bear no particular relationship to the dynamic environments of which they are a part (Couclelis 1992). “Points, lines, and polygons that define vector objects do not have naturally occurring counterparts in the real world,” explained Couclelis (1992, p. 66). They are approximations of environmental features, but without any theoretical or empirical link to their geographies (Freundschuh and Egenhofer 1997). The way people conceptualize and operate in space is an important consideration for the mapping of crime risk throughout landscapes. Cartographically modeling these conceptualizations and the spatial influence of criminogenic features in a GIS in a way that reflects the actors’ views is an important part of what Freundschuh and Egenhofer (1997) describe as “Na¨ıve Geography, a set of theories of how people intuitively or spontaneously conceptualize geographic space and time” (Egenhofer and Mark 1995), and can yield more meaningful and actionable spatial intelligence for use by public safety professionals (Frank 1993; Mark 1993; Freundschuh and Egenhofer 1997).
The best way to map crime factors for the articulation of criminogenic backcloths (Brantingham and Brantingham 1981) is to operationalize the spatial influence of each factor throughout a common landscape rather than atheoretically map the factors as points, lines, or polygons in a manner that keeps them disconnected from their broader social and environmental contexts. The concept of spatial influence refers to the way in which features of a landscape affect places throughout the landscape. The connection between criminogenic features and shooting incidents depends on one’s ability to operationalize risk emanating from such features to all places throughout a landscape. Defining vulnerable places for shootings, then, is a function of the combined spatial influence of criminogenic features throughout a landscape that contribute to crime by attracting and concentrating on illegal behavior. Spatial influence can be cartographically modeled with a GIS to produce risk map layers for each criminogenic feature. So, while all places might carry some risk of shootings, some places are riskier than others because of the spatial influences of certain criminogenic features known to correlate with shooting incidents. Fortunately, decades of criminological research have identified a variety of independent variables to be significantly correlated with a range of crime outcomes that can be used to inform such expectations and to cartographically model them in a GIS, accordingly.
Operationalizing the spatial influence of crime risk factors addresses various theoretical and methodological issues concerning the use of GIS for crime forecasting and cluster analysis (Freundschuh and Egenhofer 1997). Though, crime analysis can yield different results when the same crime correlate is modeled in a GIS according to a variety of empirically justified spatial influences. To illustrate the issues at hand, presented in the next section is an illustration of the primary methods of operationalizing spatial influence of risk factors for shootings in one city.
Demonstrating Methods Of Investigating The Concentration Of Shootings
Figure 1 shows point symbols representing the locations of shooting incidents (the crime) and bars, clubs, fast-food restaurants, check-cashing outlets, and liquor stores (the crime generators) in Irvington, NJ. These crime generators, or criminogenic features of the landscape, are correlated with shooting incidents in several empirical research studies, both in Irvington and other settings (e.g., Caplan et al. 2011; Kennedy et al. 2011). There are 102 features and 60 shooting incidents from 2007 represented on the map in Fig. 1. Visual inspection of the map suggests that shooting incidents are distributed in a similar way as criminogenic features. However, only one shooting incident was at the exact same address as a fast-food restaurant.
Bars, clubs, fast-food restaurants, check=cashing outlets, and liquor stores are often not the exact locations where associated crimes happen. Rather, shootings occur at places that are in some way defined or influenced by them. As illustrated in Fig. 2, the spatial influence of these features on shooting incidents is related to their concentration at places throughout the municipality and was operationalized as a raster density map. Shooting incidents are cartographically modeled as more likely to happen at places where bars, clubs, fast-food restaurants, check-cashing outlets, and/or liquor stores are most concentrated. That is, the area over which these features may have an influence on the occurrence of shootings is not modeled as limited to the precise location of the feature itself but is likely to diffuse to nearby places. “Places” are defined in the raster map as cells sized 100 ft by 100 ft, and the distal limits of nearby features (i.e., the bandwidth or search radius) used to define the density of each place were set at 1,480 ft (i.e., approximately four blocks; a meaningful sphere of influence for these criminogenic features as attributes of places within the radius). The density map is symbolized according to standard deviational breaks, with all places colored in darker gray having density values greater than +2 standard deviations from the mean density value – which statistically puts these places in the top 5 % of the most densely populated with criminogenic features. As shown on the map, places with greater concentrations of criminogenic features appear to be more frequented by shootings than the bars, clubs, fast-food restaurants, check-cashing outlets, or liquor stores themselves (compared to Fig. 1). In fact, 13 out of 60 (22 %) shootings during 2007 occurred at places with density values above +1 standard deviations.
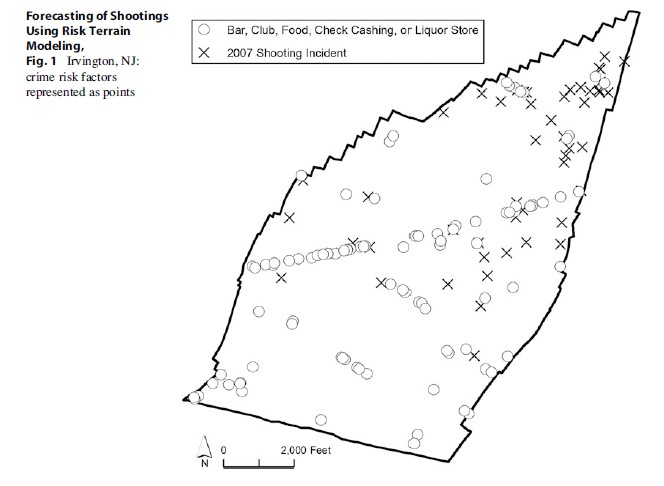 Forecasting of Shootings Using Risk Terrain Modeling, Fig. 1 Irvington, NJ: crime risk factors represented as points
Perhaps bars, clubs, fast-food restaurants, check-cashing outlets, and liquor stores are the venues where most suitable victims hang out or where the most likely and motivated offenders visit, become intoxicated, or lose self-control. However, due to increased police presence or other capable guardians such as bouncers, witnesses, or CCTV cameras, offenders do not shoot their victims inside or directly outside of such facilities. Rather, shootings are more likely to occur at certain distances away. Thought of in this way, the spatial influence of bars, clubs, fast-food restaurants, check-cashing outlets, and liquor stores on shootings is more a function of distance from the closest feature rather than the presence or absence of the feature at the shooting incident location. Figure 3 presents a map that operationalizes this distal spatial influence with a 370 ft buffer (about 1 block) around all features. Thirty-one shootings occurred within one block from a bar, club, fast-food restaurant, or liquor store. The operationalized spatial influence of the highest risk created by these features to be all places within 370 ft – a definition that was grounded in theory and empirical research – identified places with more than half (52 %) of all shooting incident locations. These results are arguably due to identifying a larger catchment area to which shootings are aggregated. Compared to feature points themselves, this is true. However, the coverage area of places with density values above +1 standard deviations is 0.806 mile2, and the coverage area of places within one block of a criminogenic feature is 0.725 mile2. So, more shootings occurred in a smaller area that was deemed affected by nearby criminogenic features in a conceptually meaningful way.

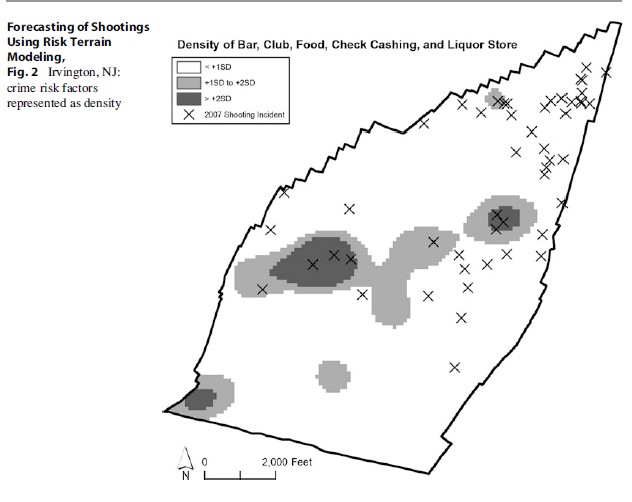 Forecasting of Shootings Using Risk Terrain Modeling, Fig. 2 Irvington, NJ: crime risk factors represented as density
The most meaningful cartographic model of places in Irvington that are at the greatest risk of shootings is one that operationalizes the spatial influence of bars, clubs, fast-food restaurants, check-cashing outlets, and liquor stores to be up to a certain distance away. This might not be the case in other jurisdictions or for other crime types, but it is corroborated by existing research, and it reinforces the importance of modeling these criminogenic features in commensurate ways on a map. This reinforces the notion that the study of crime concentration and approaches to crime analysis and forecasting cannot be a-theoretical and must be evidence based. They must be grounded in ways that account for the dynamic interaction of all criminogenic features throughout a landscape.
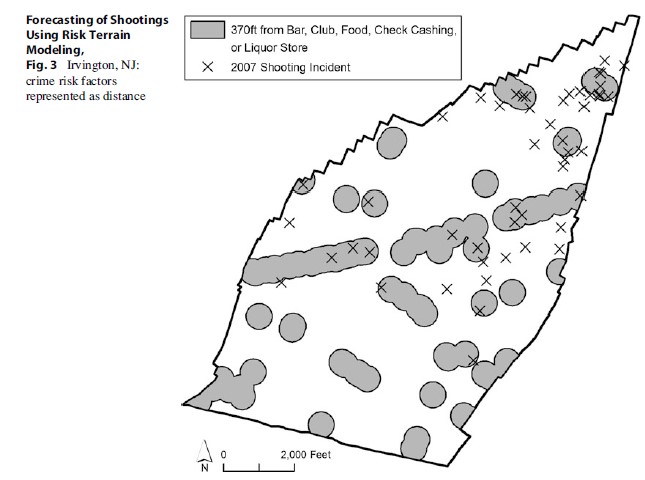 Forecasting of Shootings Using Risk Terrain Modeling, Fig. 3 Irvington, NJ: crime risk factors represented as distance
Combined Spatial Influences Of Criminogenic Features: Risk Terrain Modeling
The inclusion of multiple risk factors for the place-based study of shootings allows one to consider the interaction between the offender and the environment. Particularly, the potential for crime occurrence as a function of the illegal behavior that one could expect from motivated offenders at these locations. For example, risk from gang membership could be measured as the addresses of all known gang members’ residences and operationalized as a density map if the spatial influence of these features is understood as “areas with greater concentrations of gang members residing will increase the risk of those places having shootings.” Risk from bus stops could be operationalized as a distance map up to 555 ft away if the spatial influence of these features is understood as “up to one and a half blocks away from bus stops are at greater risk for shootings because targeted victims are most vulnerable when they arrive at or leave these destinations.” A school risk factor could be operationalized using evidence that “distances between one and three blocks (between 370 ft and 1,110 ft) are at the greatest risk for shootings”; public housing risk could be operationalized using knowledge that “distances up to one block (up to 370 ft) are at greatest risk for shootings.”
Once shooting risk factors are identified and operationalized to maps according to their spatial influences, they can be combined in a geographic information system (GIS) to show their compounded presence, absence, or intensity at every location throughout the landscape. In such a composite map, crime explanations are accounted for by different factors that tie different components of risk together, rather than on their own, to explain environmental influences and impacts on shooting events. Clustering of illegal shootings at particular areas, then, is explained by the unique combination of factors that make these areas opportune locations for such crime.
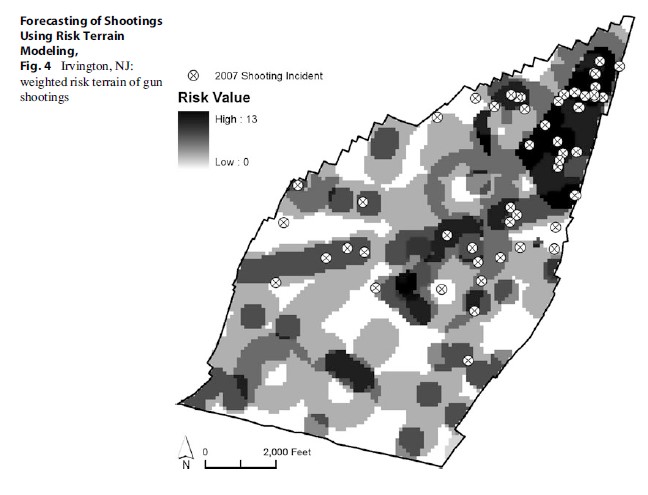 Forecasting of Shootings Using Risk Terrain Modeling, Fig. 4 Irvington, NJ: weighted risk terrain of gun shootings
Risk terrain modeling (RTM) is a method of spatial risk assessment that utilizes a GIS to attribute multiple qualities of the real world to places on a digitized map. RTM builds upon underlying principles of environmental criminology and problem-oriented policing and offers a statistically valid way to articulate and communicate criminogenic and vulnerable areas at the micro-level. It “paints a picture” of place-based environmental context for criminogenesis.
Figure 4 is a risk terrain for shootings that includes all of the aforementioned risk factors and that was produced in accordance with the steps described by Caplan and Kennedy’s (2010) Risk Terrain Modeling Manual. Essentially, it is the product of the summed risk map layers of operationalized spatial influences of bars, clubs, fast-food restaurants, check-cashing outlets, and liquor stores; gang members’ residences; bus stops; schools; and public housing, respectively. The co-location of the spatial influence of these risk factors at a place increases the place’s risk value accordingly. It may be expected that higher risk places in Irvington were the most conducive for shootings to occur and, therefore, would be most likely to host shooting incidents in 2007, unless one or more risk factors were mitigated at these places. Logistic regression results for this risk terrain suggest that for every unit increase of a place’s (i.e., 100 ft×100 ft cell’s; n = 3,975) risk value, the likelihood of a shooting occurring there in 2007 increased by 35 % (B=0.30; S.E. =0.045; Wald =43.67; df=1; Exp (B)=1.35; p < 0.001). For places with one or more risk factors, we can be 95 % confident that if shootings happened in 2007 the likelihood of them happening at these places was between 23 % and 48 % greater than other places in Irvington (p < 0.001). According to results of a chi-squared test, more than 53 % of all shootings that happened in 2007 occurred at places which comprised about 15 % of the area (where shootings could have been geocoded) of Irvington (Pearson chi-square=88.37, df=12, p < 0.001, n=3,975). That is, 15 % of the highest-risk places in Irvington accounted for more than 50 % of shooting incidents.
Open Questions For Further Research
Although shootings may occur at different places from one incident to the next, they are most likely to occur at places where features of the landscape better enable such illegal activity to happen. The risk terrain model presented above does not include many (if any) dynamic risk factors. That is, the locations of school, bars, etc., do not change drastically from year to year. Therefore, this “time-stable” risk terrain model, created with data current for the year 2007, is also likely to predict micro-level shooting locations during 2008. This spatial forecasting strategy for shooting incidents, based solely on environmental context and not on prior shooting event locations, should be valid even if shooting locations change over time. Results of a logistic regression suggest that for every unit increase of a place’s risk value, the likelihood of a shooting occurring there in 2008 increased by 28 % (n = 3,975; B=0.24; S.E.=0.045; Wald=29.37; df=1; Exp(B) =1.28; p < 0.001). So, the likelihood of a shooting happening at particular 100 ft-by-100 ft places in Irvington during 2008 significantly increases as each additional risk factor influences that place. Fifteen percent of the highest-risk places in Irvington in 2007 accounted for more than 43 % of future shooting incidents in 2008 (Pearson chi-square ¼ 51.63, df=12, p < 0.001, n =3975).
Although practically meaningful and statistically significant, the predictive validity of the 2007 risk terrain model for 2008 shooting incidents is not as strong as that for 2007 shootings. This is likely because changes that occurred to the Irvington environment throughout 2007 as a result of other crime events, police activities, or social interventions are not accounted for in the risk terrain model and subsequent year-long risk assessment of place-based criminogenesis. These activities and characteristics of the environment could be added to the model to make it more representative of the criminogenic environment during 2008 and to improve its predictive validity. Even as is, the risk terrain model successfully demonstrates the substantial influence that environmental context has on illegal behavior and crime occurrence. Such information can help police commanders and other community stakeholders stay ahead of crime problems by assessing the risk for serious crime hot spots to emerge.
Discussion And Conclusion
This research paper reviewed ways of using criminogenic features to explain the emergence and concentration of shooting incident locations. Risk terrain modeling is one method for modeling place-based risks in a GIS. The risk terrain model produced with thoughtfully operationalized criminogenic features, selected according to findings from previous empirical research, yielded a valid and reliable place-based forecasting model. Operationalizing the spatial influence of criminogenic features to maps was an important task for maximizing the construct validity of the impact these features had on crimes. Combining these maps in a GIS articulated environmental contexts of places that were most likely to attract, enable, and/or generate criminal shooting incidents as a function of the combined influences of criminogenic features in Irvington. Resulting maps can be used to efficiently allocate resources and target interventions.
Police officers are often well aware of the factors associated with shooting incidents in their jurisdictions, and their intuitions about such relationships tend to enjoy support from empirical literature. Gun shootings can occur at similar places to other types of illegal behavior, such as open-air drug markets, gang membership/ territories, or armed robberies. There is also specialization in terms of where shootings occur – both as a function of the underlying conditions most suitable for related or precursor crimes and as a function of where certain opportunities exist (e.g., where victims are located). Take out eateries, for instance, are characterized by high foot traffic and late hours of operation, making it difficult to distinguish legitimate customers from those loitering for unlawful purposes. Due to the relative lack of guardianship and concentration of potential offenders and victims, such eateries can create ideal environments for shooting incidents (Cohen and Felson 1979). Including measures of environmental risks for shootings yields a better model of where future shooting incidents are likely to occur compared to predictions made with past violent shooting incidents alone. Risk heterogeneity of environments, as articulated by risk terrain maps, exists prior to the initial victimization and can be enduring without proper intervention efforts. Certain environments may also enable a contagion effect that promotes (re)victimizations in close proximity and soon after an original shooting occurs.
Crime mapping has become a standard function of law enforcement agencies throughout the United States. Mapping innovations directly contribute to the police function and have moved the field towards a place-based approach. This is because offenders occupy space and bring to certain locations characteristics that might threaten others and disrupt social interaction at these locations. They may also engage in illegal activities (such as gangs or drugs) that themselves change the risk character of these locations (and also attract attention from law enforcement). Most often a crime analyst’s measure of the presence of offenders is designated as the number of crime incidents reported or arrests that are made and tabulated by police in crime reports. But, there are other types of measures to use that are more enduring than the crime event. This point alludes to human ecologists’ interests in studying urban processes in which “the whole is greater than the sum of its parts” – where the focus is on the potential for, or risk of, crime in areas that comes as a result of the characteristics found in these areas. As Abbott (1997) states, “the Chicago School thought that no social fact makes any sense abstracted from its context in social (and often geographic) space and social time. .. .Every social fact is situated, surrounded by other contextual facts and brought into being by a process relating it to past contexts” (1152).
Contextual forecasting models are repeatedly found to be more accurate in predicting future crime locations than are models based only on previous crime occurrences (e.g., Johnson et al. 2008; Caplan and Kennedy’s 2010; Kennedy et al. 2011; Groff and La Vigne 2002). Tying predictions of shootings and other crimes to geographic locations provides the basis for connecting attributes of space to actual behavior that occurs at these places. It also takes the police beyond a tactical reaction to crime occurrence to one that is more strategic – anticipating where resources will be needed and to prevent newly emerging crime problems using contemporary evidence-based and interdisciplinary practices.
Bibliography:
- Abbott A (1997) Of time and space: the contemporary relevance of the Chicago. Soc Forces 75: 1149–1182
- Bernasco W, Block R (2010, online first) Robberies in Chicago: a block level analysis of the influence of crime generators, crime attractors, and offender anchor points. J Res Crime Delinq 48(1):33–57
- Bowers KJ, Johnson SD, Pease K (2004) Prospective hotspotting: the future of crime mapping? Br J Criminol 44(5):641–658
- Braga AA, Weisburd DL (2010) Policing problem places. Oxford University Press, New York
- Brantingham PJ, Brantingham PL (1981) Environmental criminology. Sage, Beverly Hills
- Brantingham PJ, Brantingham PL (1995) Criminality of place: crime generators and crime attractors. Eur J Crim Policy Res 3:1–26
- Caplan JM (2011) Mapping the spatial influence of crime correlates: a comparison of operationalization schemes and implications for crime analysis and CJ practice. Cityscape 14(3):57–83
- Caplan JM, Kennedy LW (2010) Risk terrain modeling manual: theoretical framework and technical steps of spatial risk assessment. Rutgers Center on Public Security, Newark. Available at www.riskterrainmodeling.com
- Caplan JM, Kennedy LW, Miller J (2011) Risk terrain modeling: brokering criminological theory and GIS methods for crime forecasting. Justice Q 28(2):360–381 [2010, online first]
- Cohen LE, Felson M (1979) Social change and crime rate trends: a routine activity approach. Am Sociol Rev 44:588–608
- Couclelis H (1992) People manipulate objects (but cultivate fields): beyond the raster-vector debate in GIS. In: Frank A, Campari I, Formentini U (eds) Theories and methods of spatio-temporal reasoning in geographic space. Lecture notes in computer science 639. Springer, New York, pp 65–77
- Eck JE, Weisburd D (1995) Crime places in crime theory. In: Eck JE, Weisburd D (eds) Crime and place, crime prevention studies, vol 4. Willow Tree Press, Monsey, pp 1–34
- Egenhofer M, Mark D (1995) Na¨ıve geography, pp 1–15. In: Frank A, Kuhn W (eds) Spatial information theory – a theoretical basis for GIS, international conference COSIT ‘95, Semmering, Lecture notes in computer science 988. Springer, New York
- Frank A (1993) The use of geographical information systems: the user interface is the system. In: Medyckyj-Scott D, Hearnshaw H (eds) Human factors in geographic information systems. Belhaven Press, London, pp 3–14
- Frank A, Mark D (1991) Language issues for GIS. In: Maguire D, Goodchild M, Rhind D (eds) Geographic information systems: principles. Longman, London, pp 147–163
- Freundschuh SM, Egenhofer MJ (1997) Human conceptions of spaces: implications for geographic information systems. Trans GIS 2(4):361–375
- Groff ER, La Vigne NG (2002) Forecasting the future of predictive crime mapping. In: Tilley N (ed) Analysis for crime prevention, vol 13, Crime prevention studies. Criminal Justice Press, Monsey, pp 29–58
- Johnson SD (2010) A brief history of crime concentration. Eur J Appl Math 21(4/5):349–370
- Johnson S, Bowers KJ, Birks D, Pease K (2008) Predictive mapping: accuracy for different units of analysis and the role of the environmental backcloth. In: Weisburd D, Bernasco W, Bruinsma G (eds) Putting crime in it’s place: units of analysis in spatial crime research. Springer, New York, pp 171–198
- Kennedy LW, Van Brunschot EG (2009) The risk in crime. Roman and Littlefield, New York
- Kennedy LW, Caplan JM, Piza E (2011) Risk clusters, hotspots, and spatial intelligence: risk terrain modeling as an algorithm for police resource allocation strategies. J Quant Criminol 27:339–362
- Koflas JM, Hipple NK, McGarrell E (2011) The new criminal justice: American communities and the changing world of crime control. Routledge, New York
- Mark D (1993) Human spatial cognition. In: MedyckyjScott D, Hearnshaw H (eds) Human factors in geographical information systems. Belhaven Press, London, pp 51–60
- Moreto WD, Piza EL, Caplan JM (2011) A plague on both your houses?: risks, repeats and reconsiderations of urban residential burglary. Paper presented at the American society of criminology annual meeting; Washington, DC
- Ratcliffe JH, Rengert GF (2008) Near repeat patterns in Philadelphia shootings. Secur J 21(1–2):58–76
- Sherman LW, Gartin PR, Buerger ME (1989) Hot spots of predatory crime: routine activities and the criminology of place. Criminology 27:27–55
- Spelman W, Eck JE (1989) Sitting ducks, ravenous wolves, and helping hands: new approaches to Urban policing. Public Aff Comment 35(2):1–9
- Weisburd D (2008) Place-based policing. Ideas in policing series. Police Foundation, Washington, DC
- Wells W, Wu L, Ye X (2011) Patterns of near-repeat gun assaults in Houston. J Res Crime Delinq. Published online 12 May 2011
See also:
Free research papers are not written to satisfy your specific instructions. You can use our professional writing services to buy a custom research paper on any topic and get your high quality paper at affordable price.
ORDER HIGH QUALITY CUSTOM PAPER

Always on-time

Plagiarism-Free

100% Confidentiality
