
This sample Theil Index Research Paper is published for educational and informational purposes only. If you need help writing your assignment, please use our research paper writing service and buy a paper on any topic at affordable price. Also check our tips on how to write a research paper, see the lists of research paper topics, and browse research paper examples.
The Theil index, named for Dutch econometrician Henri Theil (1924-2000), is a special case of the family of inequality measures called the Generalized Entropy Measures. In its aggregate form, the Theil index is a measure of overall inequality. In addition, it lends itself to additive decomposability, a property that is extremely useful for simultaneously examining three aspects of inequality in a society divided into mutually exclusive and completely exhaustive social groups (e.g., based on gender, caste, race, religion, and so forth). Economists have used the decomposed version of the Theil index effectively to identify and highlight important sources of inequality in a given population. (e.g., Mookherjee and Shorrocks 1982; Concei^ao and Galbraith 2000). While this exercise is indeed efficacious, it is important to bear in mind that this is essentially an ex-post accounting of inequality as constituted by intergroup and intragroup inequalities, rather than a statement of causation.
With the assumption that individuals are grouped into m mutually exclusive and completely exhaustive groups g1, …, gm, each with n. individuals, overall inequality can be represented as follows:
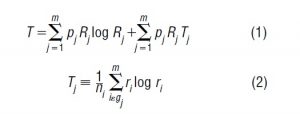
The decomposed version as stated above has two components that are interpreted below. However, it should be noted that inequality measures, such as those in equations (1) and (2), can be defined with respect to any number of classifications. For instance, Pan Yotopoulos and Jeffrey Nugent (1976) report Fisher’s index with respect to income classes i, sector j, educational attainment k, age m, and region n. The number of terms in the equation will be equal to the number of levels of stratification considered. For instance, in the expression above, the number of levels is two: society divided into groups, and groups comprising individuals. Fisher’s index will accordingly have five levels of stratification.

In both interpretations, T is treated in (1) as a measure of the general degree of inequality in a society or country, but the former characterization of the right side of the equation differs from the latter. The first term on the right hand side of (1) represents the extent of between-group inequality (B) across all ethnic groups in the population of focus. Rj is the ratio of the mean income for the jth group to the mean income for the entire population, while p. is the jth group’s population share. The second term represents the extent of within-group inequality (W) across all ethnic ratio of individual income or wealth to mean income or wealth for group j.
Conceiao and Galbraith compute the between-group component of Theil’s T from wage or earnings data aggregated by industrial sectors in a very large number of countries, and by lopping off the within-industry component of wage variation in Theil’s T, they arrive at a lower bound estimate of dispersion (Concei^ao and Galbraith 2000).Deshpande, instead of focusing on industrial variations in compensation, consider the Theil’s T from the perspective of variations in income or earnings across the major racial and ethnic groups that comprise a given society. They also presume that the identity of the groups is understood within the norms and conventions of the society in question. Note that under this interpretation, the weights in the Theil index virtually compel us to think of subaltern groups as minorities, or at most, modest majorities. Certainly, the interpretative validity becomes cloudy when the subaltern group is a substantial majority, as in South Africa.
The relationship between these three components is of more than just academic interest. The conventional interpretation of this equation would read it from left to right, where overall inequality would be the factor in exacerbating intergroup and intragroup inequality.Thus, B and W can actually drive overall inequality, or, more broadly, group affiliation and allegiance are independently salient in explaining overall inequality. Seen this way, any analysis of overall inequality will be necessarily incomplete without reference to B and W. However, given the caveat mentioned above, namely, that this is an ex-post accounting of overall inequality, the decomposed version of the Theil index cannot be used as a basis for inferring any kind of causation. Estimation over time is important to give clues about the relative contribution of B and Wto a change in overall inequality.Deshpande raise the following questions suggested by this construction of the Theil index: Is it group difference or the general level of stratification across a population that is more decisive in shaping economic disparity? Does a higher degree of intergroup inequality necessarily produce greater levels of general inequality, or is the higher level of intergroup inequality mitigated by lower levels of within-group inequality? Does a higher level of general economic inequality produce greater levels of intergroup inequality?
The calculated values of individual components of B and W in equation (1) above need to be interpreted with care. Given that the mean incomes of the subaltern groups will necessarily be less than the overall mean incomes, the Rs will be less than unity. Thus, the logs will be negative, and that, by construction, will make the overall B less than the overall W. Numerically, this will imply that the relative contribution of B to overall inequality will be substantially less than that of W (Paul [1999] finds the same for Australian household expenditure survey data). Before drawing the prima facie inference that W matters more than B, it would be good to remember that this outcome is a consequence of the construction of the index, and does not necessarily reflect the relative importance of B and W.
Bibliography:
- Conceição, Pedro, and James K. Galbraith. 2000. Constructing Long and Dense Time-Series of Inequality Using the TheilIndex. Eastern Economic Journal 26 (1): 61–74.
- Darity, William, Jr., and Ashwini Deshpande. 2000. Tracing the Divide: Intergroup Disparity across Countries. Eastern Economic Journal 26 (1): 75–85.
- Mookherjee, Dilip, and Anthony F. Shorrocks. 1982. A Decomposition Analysis of the Trend in UK Income Inequality. Economic Journal 92 (368): 886–902.
- Paul, Satya. 1999. The Population Sub-group Income Effects on Inequality: Analytical Framework and an Empirical Illustration. Economic Record 75 (229): 149–155.
- Yotopoulos, Pan A., and Jeffrey B. Nugent. 1976. Economics of Development: Empirical Investigations. New York: Harper and Row.
See also:
Free research papers are not written to satisfy your specific instructions. You can use our professional writing services to buy a custom research paper on any topic and get your high quality paper at affordable price.
ORDER HIGH QUALITY CUSTOM PAPER

Always on-time

Plagiarism-Free

100% Confidentiality
