
This sample Meta-Analysis Research Paper is published for educational and informational purposes only. If you need help writing your assignment, please use our research paper writing service and buy a paper on any topic at affordable price. Also check our tips on how to write a research paper, see the lists of health research paper topics, and browse research paper examples.
General Aspects
Meta-analysis includes a set of methods that can combine quantitatively the evidence from different studies in a mathematically appropriate way. Combining data may improve statistical power, when there are several small studies on a specific question, but each one of them is largely underpowered or has not been designed to address that research question. Meta-analysis may provide a precise and robust summary estimate after a systematic and rigorous integration of the available evidence. In addition, meta-analysis is also useful for listing and possibly exploring sources of bias, quantifying between-study heterogeneity, and proposing some potential explanations for dissecting genuine heterogeneity from bias.
Any type of quantitative data may be combined through meta-analysis. These include, but are not limited to, randomized controlled trials, observational studies, diagnostic test accuracy studies, and prevalence studies. Here we will discuss primarily meta-analyses of randomized controlled trials, and will also touch briefly on issues that pertain to the synthesis of other types of data.
Meta-analysis may be performed retrospectively or prospectively. Most meta-analyses to date have been retrospective. When a prospective meta-analysis is performed, a number of studies are designed and conducted with the anticipation that their data will be combined and analyzed together eventually. The whole procedure is different from a multicenter prospective trial because in prospective metaanalysis, the research protocols of the included studies may be similar but not necessarily identical.
The advent of evidence-based medicine has challenged our understanding about the relative merits of various sources of information. Expert opinion that has had major prestige and influence in clinical and public health decision-making in the past can sometimes be very misleading. Therefore, hierarchies of evidence developed in the 1990s not only displaced expert opinion from its prominent place, but also ranked it at the worst possible tier. Conversely, meta-analysis reached the top tiers of these hierarchies.
The question of whether meta-analyses of many small trials conform with the results of single large trials is important for public health. Theoretically, large trials and meta-analyses should give the same results in the absence of bias. Empirical evidence suggests that for randomized trials, studies with over 1000 subjects tend to have similar results as meta-analyses of smaller studies, but discrepancies that are beyond what can be accounted for by chance may still occur in 10–30% of the cases. In these situations, large trials tend to give more conservative results, but this is not always the case. Differences in the exact estimate of the effect sizes are even more common; in many cases these discrepancies do not reach formal statistical significance probably due to low power. Discrepancies between meta-analyses of small trials and larger trials also tend to be more frequent for secondary than for primary endpoints (Ioannidis et al., 1998).
Background For A Meta-Analysis Protocol
Research Questions
The first important step in conducting a meta-analysis is formulating unambiguous research questions. Well-defined questions help to define the boundaries of the evidence to be reviewed, the literature search strategy, and the inclusion criteria, and may also inform the choice of analytic methods and the interpretation of the results.
The PICO approach (i.e., patient, intervention, comparator, and outcome) to specify parameters to be addressed is a common method to formulate research questions for meta-analysis. For the evaluation of most interventions, the PICO approach assumes that the type of studies to be analyzed is the randomized controlled trial. One might broaden this approach by including experimental as well as observational studies.
Literature Search And Sources Of Evidence
Retrospective meta-analysis depends on data that have already been generated, and these data may or may not have been published. Unpublished data may be difficult to retrieve, but even published data may need to be identified and collected from different sources. PubMed is a default source for searching relevant published articles, but depending on the topic other databases may contain articles that are not indexed in PubMed. For clinical trials, the Cochrane Library’s Controlled Trials Registry is a valuable source for comprehensive searches.
Bibliographic databases are likely to become more inclusive and even larger in the future. However, electronic search strategies currently fail to identify all pertinent studies. Sensitive strategies will identify a high proportion of relevant literature but at the cost of manually screening through many irrelevant articles. Subject-specific databases, such as BIOSIS, CINAHL, and PsychLit, should be searched when appropriate.
Other methods for identifying information include manually searching through relevant journals, screening reference lists and trial registries, perusal of available trial registries, FDA files in public view or after special request, and personally contacting pharmaceutical and medical device companies, as well as colleagues and researchers who may be aware of other published or unpublished studies. Prospective registration of trials has been adopted since 2004 (DeAngelis et al., 2004) and trial registries may offer an increasingly relevant reference to identify trials that have been completed and others that are ongoing. Registration is increasing and the World Health Organization (WHO) effort brings together the largest current registries that have over 50 000 current and completed studies (Zarin et al., 2007). However, not all trials are being registered as of now, and registration has not been adopted for other types of research where meta-analysis may be applied.
Study Selection
Identified studies and data sets should be evaluated according to a prespecified protocol using parameters defined in the PICO approach discussed earlier. Failure to adhere to a well-defined protocol may produce misleading results, especially if the exclusion of a relevant study or the inclusion of an inappropriate study leads to considerable alteration of the summary estimates. Selection of studies based on availability of reported data for a specific outcome may lead to bias due to selective outcome reporting. Metaanalysts should make efforts to obtain additional information on the relevant outcomes from the primary investigators in these circumstances.
Quality Assessment Of The Original Studies
The studies included in a meta-analysis must ideally have sufficient internal validity to produce reliable results. However, large, well-conducted studies with absolutely no biases are not the norm in biomedical research. Issues related to the study quality should be incorporated into the meta-analysis and explored as potential sources of heterogeneity or bias. Sometimes, poor quality may emanate from investigators, sponsors, or other people involved in a study who are aware of these poor choices, but nevertheless they implement them. The typical motive is to inflate treatment effects, and poor quality usually means also a shift in the results in one specific direction. Quality may also be poor due to lack of knowledge and familiarity with research methods. These quality deficits may also be a surrogate of other deficits in the design, conduct, and analysis of a study. In this case, the effect sizes may be affected in either direction, and actually it may be more common to get deflated rather than inflated effect sizes. Admittedly, separating conflicted knowledge from ignorance is not always easy.
Assessing the quality of a study can sometimes be difficult because it can be inferred only from published information and the relevant information may be poorly reported or unavailable. Many quality scales are circulating in the literature for appraising the reports of primary studies. However, the validity of the use of any quality scales has been questioned (Juni et al., 1999); occasionally, different quality scales can result in different conclusions. Summary scores are popular in the literature but should generally be avoided since they can be misleading. Lack of one quality item is not equivalent to lack of a different one and the composite effects of multiple quality deficits are hard to predict. Whereas early empirical investigations proposed that studies that lack allocation concealment and doubleblinding tend to report larger effect sizes, subsequent data suggest that this is not necessarily the case and the effects of quality deficits may vary on a case-by-case basis. Moreover, reported quality is only a surrogate of the true quality of a study, for example, a study may have done something properly but this may not be reported and vice versa. In all, it is prudent to record carefully information on aspects of the design and conduct of studies that are considered as potentially important. Their impact on the results should be examined separately and on a case-by-case basis, without using summary scores. The situation with quality scoring is even more confusing in the observational studies literature and is further compounded by the lack of reporting standards for most observational research until recently.
Statistical Methods: Heterogeneity
There is a widespread misconception that the goal of metaanalyses is to force heterogeneous results from individual studies into a single estimate. Although obtaining a single treatment effect may be appropriate in many circumstances, a more interesting application of meta-analysis is to explore heterogeneity among different trials and to understand possible reasons for these differences. There can be two sources of variability that explain the heterogeneity in a set of studies in a meta-analysis. One of them is the variability due to sampling error, also named within-study variability. The other source of heterogeneity is the between study variability, which can appear in a meta-analysis when there is true heterogeneity among the population effect sizes estimated by the individual studies. The between study variability is due to the influence of an indeterminate number of characteristics that vary among the studies, including the characteristics of the samples, variations in the treatment, and variations in the design quality, as well as biases that may affect single studies or the field at large.
The test most commonly used for heterogeneity is the Q statistic, which is based on the chi-square distribution. The Q statistic tends to be insensitive, so significance is claimed at P < 0.10, but this does not solve the problem that it still has low power when there are few studies (<20). Conversely, it may have excessive power to detect negligible variability with a high number of studies. Another strategy for quantifying heterogeneity in a meta-analysis consists of estimating the between-study variance. The between-study variance reflects how much the true population effect sizes estimated in the single studies of a meta-analysis differ. The between-study variance depends on the particular effect metric used in a meta-analysis; it is not possible to compare values estimated from meta-analyses that have used different effect size indices.
The I2 index of inconsistency is also very popular (Higgins et al., 2002, 2003). The I2 index can be interpreted as the percentage of the total variability in a set of effect sizes due to true heterogeneity (between-study variability). For example, a meta-analysis with I2 = 0 means that all variability in effect size estimates is due to sampling error within studies. However, a meta-analysis with I2 = 50 means that half of the total variability among effect sizes is caused not by sampling error but by true heterogeneity between studies. With some simplification, percentages of 0–25%, 25–50%, 50–75%, and >75% reflect low, medium, large, and very large inconsistency, respectively (Table 1).
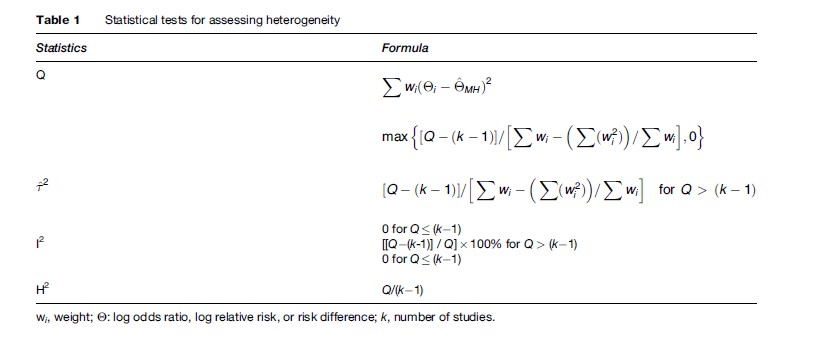
An advantage of I2 is that it is directly comparable across meta-analyses with different numbers of studies and different effect metrics. In this regard, the I2 index has important advantages with respect to the Q test. On one hand, it is easily interpretable, because it is a percentage and does not depend on the degrees of freedom. Another advantage is that it provides a way of assessing the magnitude of the heterogeneity in a meta-analysis, whereas the Q test reports about the statistical significance of the homogeneity hypothesis. On the other hand, the confidence interval around I2 is typically very large when the number of studies is small. With a small number of studies (k < 20), both the I2 index and Q test should be interpreted cautiously (Huedo-Medina et al., 2006).
Statistical Methods: Combining Binary And Dichotomous Data
To summarize the data, each study is given a weight that depends on the precision of its results. The weight is generally estimated as the inverse of the variance of the treatment effect in each study that has two components: the variance of the individual study (the within-study variance) and the variance between different studies (the between-study variance). The simplest approach to thinking about combining different results is to assume that all studies have approximated the same fixed truth and that differences among the observed treatment effects are only the result of chance. In this case, the between-study variance is assumed to be zero, and the calculations are performed with what are called fixed effects models. Fixed effects models are exemplified by the Mantel-Haenszel method and the Peto method in the case of dichotomous data.
In contrast, if the truth itself is not fixed but is believed to vary within a range of values, then each study can be seen as addressing a different true treatment effect, and these treatment effects derive from a distribution of truths with a variance equal to the between-study variance. In this case, calculations are performed with random effects models, which add the between-study variance to the within-study variance of each study. The most commonly used random effects model is that proposed by DerSimonian and Laird (Table 2). More sophisticated, fully Bayesian approaches may also be used to calculate the between-study variance. Fixed and random effects methods have also been developed for continuous outcomes (Hedges and Olkin, 1985).
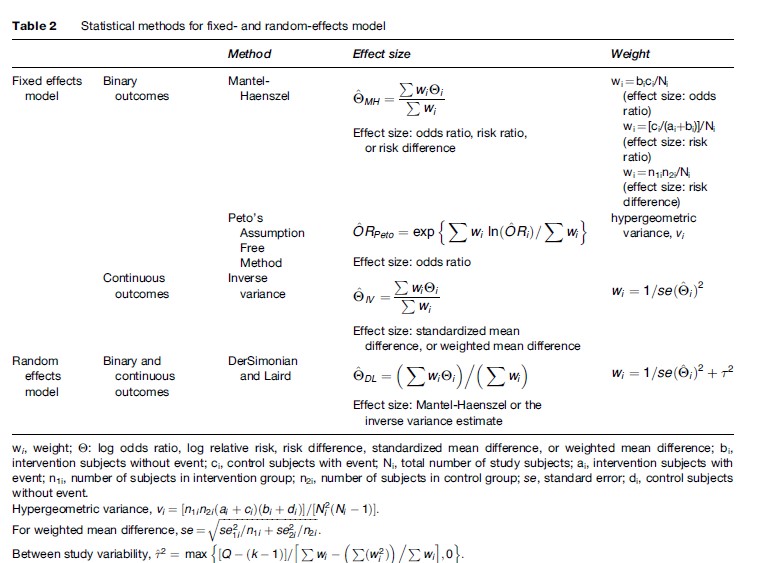
When the results of the combined studies are significantly heterogeneous or anticipated to be heterogeneous, the fixed effects models are counterintuitive and should be avoided. Conversely, in the absence of between-study heterogeneity, fixed and random effects estimates are identical. Usually, fixed and random effects estimates are similar, but major differences can occur occasionally. In terms of precision, random effects provide larger confidence intervals when heterogeneity is present because between-trial uncertainty is introduced. Compared to the DerSimonian and Laird estimates, fully Bayesian methods may sometimes result in even wider confidence intervals.
Generally, Mantel-Haenszel estimates work well even with small numbers, whereas random effects estimates are unstable. The Peto model may be associated with large bias when the data are unbalanced. Several easy-to-use software programs to combine data have become available. However, the informed researcher should be aware of the preceding caveats and should understand which formulas the software uses.

Bias
Even comprehensive searches of the published literature and all other sources of available data may not produce an unbiased sample of studies when conducting a metaanalysis. Research with statistically significant results is potentially more likely to be submitted, published, or published more rapidly than work with null or nonsignificant results. A meta-analysis of only the identified published studies may lead to an overoptimistic conclusion. This problem is known as publication bias.
Funnel plot asymmetry has been proposed as a method to assess the potential for publication bias. Small studies have greater variation in their estimation of the treatment effect and will be found to have more scattering around the mean effect, compared to the larger studies. In a funnel plot, the weight of each study, the sample size, or the inverse of the variance is plotted against the size of its treatment effect in a meta-analysis. This plot should be shaped like an inverted funnel if there is no publication bias; asymmetric funnel plots may suggest publication bias. Nevertheless, there needs to be a range of studies with varying sizes for a funnel plot to be useful. Furthermore, a skewed funnel plot may be caused by factors other than publication bias such as the study quality, the different intensity of intervention, differences in underlying risk, choice of effect measure, and chance. Finally, funnel plot interpretation is subjective and is only an informal method. Funnel plots with plain visual interpretation should be abandoned. Formal statistical tests have also been described regarding funnel plot asymmetry, such as the rank correlation test by Begg and Mazumdar, the linear regression test suggested by Egger, and the more appropriate modified regression method (Peters et al., 2006) as well as the trim and fill method (Duval et al., 2000).
All these methods are based on certain assumptions that hold only in the minority of circumstances (Lau et al., 2006). Empirical evaluations (Ioannidis et al., 2007) suggest that in the vast majority of meta-analyses, these tests should not be applied, as they may yield misleading inferences. A very common misconception is to use these tests and conclude that no publication bias exists simply because the tests don’t give a significant signal.
Besides clear-cut publication bias, time-lag bias may cause the delayed publication and dissemination of the least favorable negative results. While trials with formally statistically significant and those with no significant results take the same time to complete – with certain exceptions – the latter trials are delayed publication after their completion (Ioannidis et al., 1998). Another major source of bias is selective reporting of outcomes and analyses (Chan et al., 2004): authors do publish the results of a study, but they selectively present the most favorable analyses and outcomes. This bias is also a major threat for the validity of meta-analysis. Conversely, metaanalysis offers a unique opportunity to examine the consistency of definitions and completeness of reporting of data for specific outcomes.
Language biases have also been described, including a Tower of Babel bias, in which authors selectively publish positive studies in English language journals but negative studies in their native language journals; and a reverse language bias, where studies from certain countries consistently report mostly positive results in their local literatures or even when they publish in the English language. In many medical disciplines, the non-English literature of randomized trials has never been large, is shrinking even further, or may be of generally dubious quality. Before routinely committing to a specific approach, it would be useful to understand the contribution of different languages to the literature of the potential field.
In the world of nonrandomized evidence, the selective publication forces may be even more prominent. Significance-chasing is probably ubiquitous and may distort the evolving literature over time. A test has been proposed (Ioannidis and Trikalinos, 2007) that tries to evaluate the composite of both publication bias and selective outcome and analysis reporting bias that may result in an excess of statistically significant findings in a specific scientific field. In the absence of study and protocol registration, these biases may be very difficult to address.
Meta-Regression
Meta-regression investigates whether particular covariates (potential effect modifiers) explain any of the heterogeneity of treatment effects between studies. It is not reasonable to assume that all of the heterogeneity is explained, and the possibility of residual heterogeneity must be acknowledged in the statistical analysis. The appropriate analysis is therefore random effects rather than fixed effect meta-regression. Estimating the residual between-study variance is somewhat problematic. The estimate is usually imprecise because it is based on a rather limited number of trials. Different authors have advocated different estimates, for example, empirical Bayes or restricted maximum likelihood estimates. Moreover, conventional random effects methods ignore the imprecision in the between-trial variance estimate. One way to allow for the imprecision is to adopt a Bayesian approach, using, for example, noninformative priors. Whereas this is preferable in principle, especially when the number of trials is small or when the between-trial variance is estimated as zero, the resulting widening of the confidence intervals is rather slight in most practical examples.
Meta-regression analysis uses the individual study as the unit of observation in assessing the relationship between the magnitude of the treatment effect and different predictors. Predictors may be study-specific (e.g., the dose or route of administration of a drug) or ecological variables in which a mean or median value is taken as characteristic of the study group of patients (e.g., mean age or percentage of men or the percentage of participants with an event in the control group [baseline risk]). Ecological meta-regressions may suffer from the ecological fallacy, when the association seen with a group mean does not reflect the association for individual study participants. Given that most meta-analyses in the literature to date have included relatively few studies, it is not unfair to say that most meta-regressions have been misapplied on thin data.
Cumulative Meta-Analysis And Recursive Cumulative Meta-Analysis
The results of a meta-analysis may be seen as a sequential addition of data as more studies appear in a given order, typically chronological. Cumulative meta-analysis addresses the impact of new studies on prior summary estimates, whereas recursive cumulative meta-analysis models the changes in the cumulative treatment effect as a result of new studies, updating of old ones, or retrieval of unpublished ones. Recursive cumulative meta-analysis may be used while a comprehensive meta-analysis is being performed to investigate and present the results as a process of accumulation of missing, updated, and new information.
Effect sizes may fluctuate over time as more evidence appears in the published literature on the same question. Fluctuations of effect size as they may be presented in recursive cumulative meta-analysis may be only an issue of the uncertainty surrounding the summary effect. This uncertainty goes beyond what is conveyed typically by the 95% confidence intervals of a summary estimate by a traditional random effects meta-analysis model. Empirical data suggest that even when we have accumulated data on 2000 randomized subjects, the next trial may change the summary relative risk by about 25% (Trikalinos et al., 2004). Given that most effect sizes are relatively modest, uncertainty for the mere presence of a treatment effect is likely to exist even when several thousand subjects have been randomized. In the majority of clinically important questions, considerable uncertainty is the rule.
In addition, a more problematic type of fluctuation is when effect sizes change in the same direction as more evidence accumulates. In the most common scenario, the addition of more data tends to shrink the treatment effect. Whereas genuine heterogeneity may be operating in some of these cases, the most common explanation is that here we are dealing with biased early estimates of effect that get dissipated as better data gradually accumulate. Many early effects may disappear with more careful scrutiny and additional data. In the epidemiological literature, this phenomenon may be particularly prominent, and in discovery-oriented research with massive hypothesis testing it may be the rule rather than the exception.
Meta-Analysis Of Individual Patient Data
Most of the published meta-analyses to date have used summary data from individual studies or subgroups thereof. Meta-analyses using individual patient data from all the pertinent studies are not new, but they represent still a minority. The meta-analysis of individual patient data provides several clear advantages, such as closer involvement of the participating investigators; the ability to verify, clean, standardize, and update the data collected within the included studies; the possibility of more detailed time-to-event analyses; the ability to generate individual-based multivariate models; and the chance to assess the effect of various covariates of interest at the individual patient level avoiding potential ecological fallacies inherent in summary data (Stewart et al., 1995).
The disadvantages of this approach include the potential for retrieval bias when studies whose data are not retrievable are excluded; the potentially lower quality of updated data that have been accumulated after the end of the main follow-up period of a clinical study (e.g., extensive crossovers or incomplete information on many patients); and the time and effort required to obtain data from a multitude of investigators, especially on a retrospective basis. The first two reasons could theoretically make meta-analysis of individual patient data even less reliable than meta-analyses of published group data in some circumstances. Such studies should be encouraged, however, and may eventually become the commonly sought standard, especially with prospective meta-analyses.
Early reports have suggested that the estimates obtained by meta-analysis of individual patient data may occasionally differ from the estimates of conventional meta-analyses of the literature on the same topic. Metaanalyses of individual-level data may then provide more conservative results than conventional meta-analyses. However, the extent and frequency of the discrepancies need to be evaluated in a larger number of examples.
Meta-Analysis Of Diagnostic Test Studies
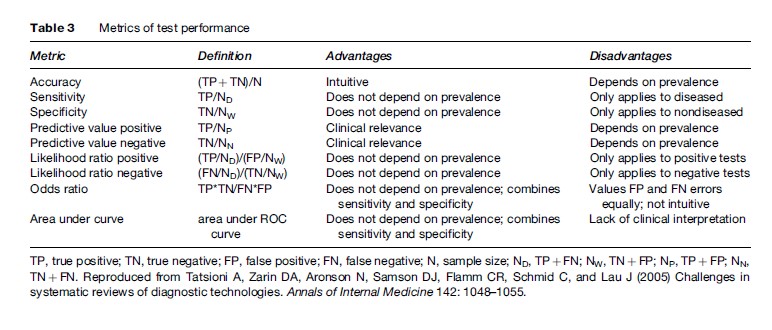
Diagnostic test results are often reported as a numerical quantity on a continuous scale, but are then used as a binary decision tool by defining a threshold above which the test result is positive and below which it is negative. Results may then be summarized in a 2 2 table reflecting the agreement between the test result and the disease state as the number of true positives, false positives, true negatives, and false negatives. Changing this threshold may change the sensitivity and specificity of the test. Test performance is described by the receiver operating characteristic (ROC) curve, which displays the true positive rate (sensitivity) on the vertical axis versus false positive rate (1-specificity) on the horizontal axis for all possible thresholds. This fundamental bivariate structure poses a challenge for constructing a single number summary to describe test performance.
Common single number measures used to describe test performance include accuracy, sensitivity, specificity, positive predictive value, negative predictive value, positive likelihood ratio, negative likelihood ratio, odds ratio, and area under the curve. Only the last four combine information about both sensitivity and specificity. This can be illustrated by the different ROC curves that each measure implies. On one hand, a constant sensitivity implies a horizontal line, a constant specificity implies a vertical line, and a constant likelihood ratio also implies a linear relationship between sensitivity and specificity. The odds ratio, on the other, describes a curve symmetric about the line where sensitivity equals specificity (Table 3).
When combining data from several diagnostic tests, the first step should be to plot the sensitivity–specificity pairs in each study on one graph. Because the plot may suggest a curvilinear relationship, the use of summary sensitivity, specificity, or likelihood ratio measures may be inadequate. Combining both sensitivity and specificity independently is approximately appropriate if we believe the test operates at a certain representative combination of sensitivity and specificity. This is usually an oversimplification. Nevertheless, because these summary measures are either proportions or ratios of proportions and so are easily combined using standard meta-analytic techniques, many diagnostic test meta-analyses have reported them. If curvilinearity is detected, it is better instead to summarize with the diagnostic odds ratio using standard methods for combining odds ratios.
The odds ratio is nevertheless still misleading, however, if the ROC curve suggests asymmetry about the line of equal sensitivity and specificity. In this case, the decrease in sensitivity corresponding to increased specificity differs between high and low sensitivity settings. An SROC curve does allow for such asymmetry. It models the linear relationship between the odds ratio and the probability of a positive test and then reexpresses this in terms of the ROC curve. It reduces to the odds ratio if the regression slope is zero so that the odds ratio is invariant to the test positivity threshold. In doing so, however, it treats the observed odds ratios as random effects, but the test positive probabilities as fixed effects. Thus, the resulting summary measure fails to incorporate all the uncertainty in the observed test results. Recently, some analysts have used bivariate random effects models to capture the randomness in both sensitivity and specificity simultaneously (Oei et al., 2003).
In diagnostic studies heterogeneity in sensitivity and specificity can result from a multitude of causes related to definitions of the test and reference standards, operating characteristics of the test, methods of data collection, and patient characteristics. Covariates may be introduced into a regression with any test performance measure as the dependent variable. To date, the most common approach to meta-regression has been to insert covariates into the SROC regression allowing the odds ratio to vary by study characteristics other than test positivity. This implies that performance is described, not by one but by multiple ROC curves.
Meta-Analysis Of Observational Studies
Theoretically, randomized controlled trials are susceptible to fewer biases than nonrandomized observational studies in evaluating the efficacy of therapeutic and preventive interventions. However, this does not mean that observational studies are always worse or they lead to necessarily different estimates. For many research questions, data from observational studies may outweigh data from randomized trials, or no data may exist from randomized trials at all. The methods to combine observational data sets follow the same principles as those outlined above for randomized trials. However, more attention is required to the appraisal of biases in single studies and in the field at large – and more conservative interpretation of the summary results is warranted – to avoid falling into the trap of spurious excessive precision offered by the data synthesis. Empirical studies have not agreed on how often the results of randomized trials and observational studies disagree with each other, but one should be aware that major disagreements may often be missed due to limited data on one or both types of evidence.
For many important questions in which randomized studies are entirely impossible, for example, the study of harmful exposures and lifestyle factors, or the study of genetic risk factors, meta-analysis of observational studies has been established as a prime method to summarize data from diverse investigators. The same principles and caveats apply to these settings as well.
Quality And Reporting Of Meta-Analyses
A large number of meta-analyses are published each year and their overall quality is a concern. Empirical evidence suggests that procedures in meta-analyses are often inadequately reported, and methodological deficiencies that may limit the validity of conclusions are also present (Fishbain et al., 2000; Moher et al., 2007). In an effort to address standards for improving the quality of reporting of meta-analyses of clinical randomized controlled trials, the Quality of Reporting of Meta-Analyses (QUOROM) checklist was published in 1999 based on a conference that was held in October 1996 (Moher et al., 1999). Given the many changes that have happened in the field in the last decade, a new version of QUOROM (called PRISMA) is in the final stages of preparation as this research paper goes to press. A respective statement for meta-analysis of observational studies (MOOSE, or Meta-Analysis of Observational Studies in Epidemiology) was published in 2000 (Stroup et al., 2000), but may also need updating in the near future. Reporting of meta-analyses of observational studies has also been shown to have common major deficits (Attia et al., 2003).
Bibliography:
- Attia J, Thakkinstian A, and D’Este C (2003) Meta-analyses of molecular association studies: methodologic lessons for genetic epidemiology. Journal of Clinical Epidemiology 56: 297–303.
- Chan AW, Hrobjartsson A, Haahr MT, Gotzsche PC, and Altman DG (2004) Empirical evidence for selective reporting of outcomes in randomized trials: Comparison of protocols to published articles. Journal of the American Medical Association 291: 2457–2465.
- DeAngelis CD, Drazen JM, Frizelle FA, et al. (2004) International Committee of Medical Journal Editors. Clinical trial registration: A statement from the International Committee of Medical Journal Editors. Journal of the American Medical Association 292: 1363–1364.
- Duval S and Tweedie R (2000) Trim and fill: A simple funnel-plot-based method of testing and adjusting for publication bias in meta-analysis. Biometrics 56: 455–463.
- Fishbain D, Cutler R, Rosomoff HL, and Rosomoff RS (2000) What is the quality of the implemented meta-analytic procedures in chronic pain treatment meta-analysis? The Clinical Journal of Pain 16: 73–85.
- Hedges LV and Olkin I (1985) Statistical Methods for Meta-Analysis. Orlando, FL: Academic Press.
- Higgins JP and Thompson SG (2002) Quantifying heterogeneity in a meta-analysis. Statistics in Medicine 21: 1539–1558.
- Higgins JP, Thompson SG, Deeks JJ, and Altman DG (2003) Measuring inconsistency in meta-analyses. British Medical Journal 327: 557–560.
- Huedo-Medina TB, Sanchez-Meca J, Marin-Martinez F, and Botella J (2006) Assessing heterogeneity in meta-analysis: Q statistic or I2 index? Psychological Methods 11: 193–206.
- Ioannidis JPA, Cappelleri JC, and Lau J (1998) Issues in comparisons between meta-analyses and large trials. Journal of the American Medical Association 279: 1089–1093.
- Ioannidis JP and Trikalinos TA (2007) The appropriateness of asymmetry tests for publication bias in meta-analyses: a large survey. Canadian Medical Association Journal 176: 1091–1096.
- Ioannidis JP and Trikalinos TA (2007) An exploratory test for an excess of significant findings. Clinical Trials 4: 245–253.
- Juni P, Witschi A, Bloch R, and Egger M (1999) The hazards of scoring the quality of clinical trials for meta-analysis. Journal of the American Medical Association 282: 1054–1060.
- Lau J, Ioannidis JP, Terrin N, Schmid CH, and Olkin I (2006) The case of the misleading funnel plot. British Medical Journal 333: 597–600.
- Moher D, Cook D, Eastwood S, et al. (1999) Improving the quality of reports of meta-analysis of randomized controlled trials: The QUOROM statement. The Lancet 354: 1896–1900.
- Moher D, Tetzlaff J, Tricco AC, Sampson M, and Altman DG (2007) Epidemiology and reports characteristics of systematic reviews. Public Library of Science Medicine 4: e78.
- Oei EHG, Nikken JJ, Verstignen ACM, Ginai AZ, and Hunink MGM (2003) MR imaging of the minisci and cruciate ligaments: A systematic review. Radiology 226: 837–848.
- Peters JL, Sutton AJ, Jones DR, Abrams KR, and Rushton L (2006) Comparison of two methods to detect publication bias in meta-analysis. Journal of the American Medical Association 295: 676–680.
- Stewart LA and Clarke MJ (1995) Practical methodology of meta-analyses (overviews) using updated individual patient data. Cochrane Working Group. Statistics in Medicine 14: 2057–2079.
- Stroup DF, Berlin JA, Morton SC, et al. (2000) Meta-analysis of observational studies in epidemiology: A proposal for reporting. Meta-analysis of Observational Studies in Epidemiology (MOOSE) group. Journal of the American Medical Association 283: 2008–2012.
- Trikalinos TA, Churchill R, Ferri M, et al. (2004) Effect sizes in cumulative meta-analyses of mental health randomized trials evolved over time. EU-PSI project. Journal of Clinical Epidemiology 57: 1124–1130.
- Zarin DA, Ide NC, Tse T, et al. (2007) Issues in the registration of clinical trials. Journal of the American Medical Association 297: 2112–2120.
- Cook DJ, Mulrow CD, and Haynes RB (1998) Systematic Reviews. Philadelphia, PA: American College of Physicians.
- Cooper H and Hedges LV (1993) The Handbook of Research Synthesis. New York: Russell Sage Foundation.
- Egger M, Davey Smith G, and Altman DG (2001) Systematic Reviews in Health Care. Meta-Analysis in Context, 2nd edn. London: BMJ Books.
- Fleiss JL (1993) The statistical basis of meta-analysis. Statistical Methods in Medical Research 2: 121–145.
- Ioannidis JP, Ntzani EE, Trikalinos TA, and Contopoulos-Ioannidis DG (2001) Replication validity of genetic association studies. Nature Genetics 29: 306–309.
- Moses LE, Shapiro D, and Littenberg B (1993) Combining independent studies of a diagnostic test into a summary ROC curve: Data-analytic approaches and some additional considerations. Statistics in Medicine 12: 1293–1316.
- Petitti DB (1999) Meta-Analysis, Decision Analysis, and Cost-Effectiveness Analysis: Methods for Quantitative Synthesis in Medicine. New York: Oxford University Press.
- Rothstein H, Sutton AJ, and Borenstein M (2005) Publication Bias in Meta-Analysis: Prevention, Assessment and Adjustments. New York: John Wiley.
- Rutter CM and Gatsonis CA (2001) A hierarchical regression approach to meta-analysis of diagnostic test accuracy evaluations. Statistics in Medicine 20: 2865–2884.
- Sutton AJ (2000) Methods for Meta-Analysis in Medical Research. New York: John Wiley.
See also:
Free research papers are not written to satisfy your specific instructions. You can use our professional writing services to buy a custom research paper on any topic and get your high quality paper at affordable price.
ORDER HIGH QUALITY CUSTOM PAPER

Always on-time

Plagiarism-Free

100% Confidentiality


