
This sample Quality Adjusted Life Years Research Paper is published for educational and informational purposes only. If you need help writing your assignment, please use our research paper writing service and buy a paper on any topic at affordable price. Also check our tips on how to write a research paper, see the lists of health research paper topics, and browse research paper examples.
Introduction
Decision makers in public health require information on an array of health and economic consequences of alternative interventions. Economic evaluations provide one type of useful input into decisions, on the costs or the value for money associated with different courses of action. Cost-effectiveness analysis refers to a specific type of economic evaluation that expresses value for money in terms of an incremental cost-effectiveness ratio. The numerator of the ratio indicates the net expected costs of a particular intervention compared to some specified alternative; the denominator indicates the net expected change in health from the intervention compared to the alternative. Quality-adjusted life years, or QALYs, are a unit of measurement for health outcomes, often used in the denominator of an incremental cost-effectiveness ratio. When incremental cost-effectiveness ratios are expressed as costs per QALY, the analysis is sometime described as cost-utility analysis, but practice varies; many researchers maintain the more general label cost-effectiveness analysis even when QALYs are used as the measure for health outcomes.
QALYs enable comparisons of diverse types of consequences on a common scale. As the name implies, QALYs are measures of longevity, in units of years of life, adjusted for the ‘quality’ of life during those years. By translating health outcomes into time-based units, each equivalent to one perfectly healthy year of life, QALYs allow the combination of information on both survivorship and the experience of health during the surviving years. Conceptualization of the latter component has varied in the literature, from relatively broad notions that encompass a wide variety of aspects of overall well-being to relatively narrow notions that pertain more specifically to elements of health. Despite the diversity of interpretations, however, the terms quality of life and health-related quality of life are often used to characterize the nonfatal part of QALYs.
Historical Overview
Although the term QALY first appeared in the published literature in 1976, some earlier precedents may be found. Klarman and colleagues (1968: 50) compared three options for treating patients with chronic renal disease in terms of life years gained, with and without adjustments for ‘‘differential[s] in the quality of life.’’ Fanshel and Bush (1970) proposed measures of dysfunction-free years in evaluation of a tuberculin skin testing program. Torrance and colleagues (1972) introduced the health day. Finally, the term quality-adjusted life year was used in two separate publications in 1976, one by Weinstein and Stason examining policies for control of hypertension and another by Zeckhauser and Shepard in a more general exploration of analytic approaches to evaluating social policies with lifesaving or health implications (Weinstein and Stason, 1976; Zeckhauser and Shepard, 1976). An article by Weinstein and Stason appearing in the New England Journal of Medicine in the following year introduced QALYs to a broad medical and public health audience and is frequently cited as a major milestone in the development of cost-effectiveness analysis in health and medicine (Weinstein and Stason, 1977). In England, a highly influential early paper applying QALYs to evaluation of coronary artery bypass grafting was Williams’s 1985 article in the British Medical Journal (Williams, 1985).
A variety of review articles have been published over time charting the growth and scope of health-related cost-effectiveness analyses and cost–benefit analyses (another type of economic evaluation that translates all consequences into monetary units). A series of early studies report on cost-effectiveness studies generally, not specifically distinguishing those studies that evaluate interventions in terms of costs per QALY gained. The trends over time reported by these reviews nevertheless indicate a substantial rise in interest in cost-effectiveness over the last several decades. For example, a 1980 review by Warner and Hutton identifies around 500 cost-effectiveness and cost–benefit studies published from 1966 to 1978, with an increase over this period from less than ten studies per year to nearly 100 studies and around half of the studies using cost-effectiveness methods (Warner and Hutton, 1980). An update in 1993 (Elixhauser et al., 1993) identified nearly 2000 studies published between 1979 and 1990, almost two-thirds of them cost-effectiveness analyses; a further update in 1998 (Elixhauser et al., 1998) found 2300 studies published between 1991 and 1996, of these around 80% using cost-effectiveness.
More recently, researchers have developed a registry of cost-effectiveness studies that report outcomes specifically in terms of costs per QALY. The researchers leading the project reviewed the literature from 1976 through 2001 and identified 533 original studies meeting their inclusion criteria. Consistent with the earlier reviews of the broader cost-effectiveness literature, a major increase in the volume of studies on costs per QALY was evident, with 228 studies over the two decades from 1976 to 1997 followed by 305 studies over the 4-year period from 1998 through 2001 (Neumann et al., 2005).
Key Concepts
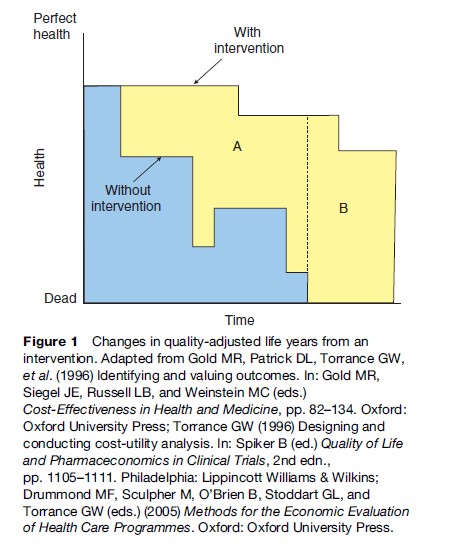
The basic notion underlying quality-adjusted life years is that the total benefits of health interventions may be summarized in terms of changes in longevity and changes in health levels, in the shorthand that is often invoked, that is changes in both ‘quantity’ and ‘quality’ of life. As shown in Figure 1, adapted from previous publications (Gold et al., 1996; Torrance et al., 1996; Drummond et al., 2005), this concept may be illustrated by plotting levels of health over time under two scenarios, one with and the other without the intervention. These plots may be understood as the potential health trajectories followed by an individual, or the expectation of health over time for a particular population. We describe the example as if it refers to a single individual, for ease of exposition. In this example, without the intervention the individual experiences both earlier declines in health (traced by the lower curve) and an earlier death (indicated by the point at which the lower curve intersects the horizontal axis), compared to a counterfactual scenario in which the intervention is applied (traced by the upper curve). The total QALYs associated with each of the alternative scenarios is represented as the area under the relevant curve, so that the gain in QALYs through the intervention is equal to the difference between the two areas. In this example, the gain in QALYs is divided into two components. Area A represents improvements in health, or gains in ‘quality’, during the time that the person is alive under either scenario, while area B indicates gains in survivorship through the intervention, adjusted for the quality of the added years. It is worth noting that one implication of this approach that has been criticized by some on ethical grounds is that QALY calculations assign lower value to extending life in those with worse health compared to extending life in those with better health.
The concept of QALYs has been linked explicitly to expected utility theory. In a decision analytic framework, QALYs are used as the unit of account in expected value calculations for decisions under uncertainty. Expected utility theory dictates that in order for these expected value calculations to be consistent with preferences over uncertain streams of health outcomes, QALYs should fulfill certain requirements of utility functions. These requirements take the form of a set of axioms, formalized by von Neumann and Morgenstern (1944). Although much has been written about empirical violations of the axioms of expected utility theory, and various alternatives have been proposed, expected utility remains the primary point of reference for most discussions of normative decision theory.
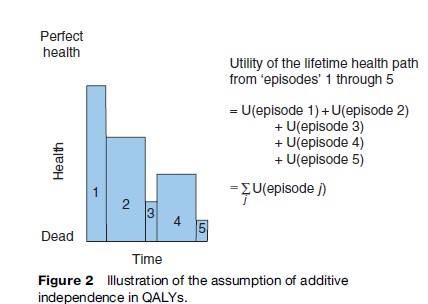
In addition to the requirements that apply to all utility functions, there are some additional assumptions that apply to QALYs in particular. The first assumption is that health experiences over time are separable, or additively independent. This means that the value attached to a health state in one period does not depend on the health states experienced in other periods. As shown in Figure 2, this assumption allows the overall utility (expressed in units of QALYs) for a sequence of health states to be computed as the sum of the utilities attached to its constituent ‘episodes’. Practically, this means that episodes of constant health levels may be valued separately and then reaggregated to obtain the overall value attached to the sequence.
A second assumption in QALYs is that quantity of life and quality of life are separable for a constant health state. More formal statements of this assumption are discussed below, but the basic idea is that valuations of a health state do not depend on the duration over which the health state is experienced. A third assumption is that a given health outcome is valued equally, irrespective of the person who experiences the outcome. Moreover, the value of one QALY is regarded as equal irrespective of whether it is gained by vaccinating against measles or averting a road traffic accident or treating depression. The common expression of this assumption is the statement that ‘a QALY is a QALY is a QALY’, and this normative assumption gives QALYs a strongly egalitarian flavor.
Pliskin et al. (1980) introduced a formal axiomatic foundation for QALYs. In their seminal article they proposed that the use of QALYs for decision making implies three properties applying to preferences over longevity and health: Mutual utility independence, constant proportional tradeoffs of longevity for health and risk neutrality for life years. These properties are summarized here with simple numerical examples.
Mutual utility independence requires that preferences over lotteries on longevity do not depend on fixed health levels, and conversely that preferences over lotteries on health levels do not depend on fixed longevity. For example, the first condition implies that if a person is indifferent between (i.e., regards as equally attractive) a certain prospect of 10 years in good health and a lottery offering equal chances at 5 years in good health or 20 years in good health, then the person should also be indifferent between a certain prospect of 10 years in poor health and a lottery offering equal chances at 5 years in poor health or 20 years in poor health. (The term lottery here refers simply to an uncertain prospect with multiple possible outcomes, and with explicit probabilities attached to each of the possible outcomes. In these simple examples with equal probabilities of two outcomes, the lottery is analogous to a flip of a fair coin to determine which outcome prevails.) The converse condition implies that if a person is indifferent between a certain prospect of 10 years in good health and a lottery offering equal chances at 10 years in poor health or 10 years in excellent health, then the person should also be indifferent between a certain prospect of 5 years in good health and a lottery offering equal chances at 5 years in poor health or 5 years in excellent health.

The property of constant proportional tradeoffs means that the fraction of a person’s remaining life that the person would trade for a given improvement in health level does not depend on the number of years of life that remain. In other words, there is a constant ‘exchange rate’ between length of time in a health state and time in perfect health. For example, constant proportional tradeoffs implies that if a person is indifferent between 20 years in poor health and 15 years in good health, then the person should also be indifferent between 16 years in poor health and 12 years in good health. In both cases, the person is willing to give up 25% of his or her remaining lifetime to live in good health rather than poor health.
Finally, risk neutrality for life years means that the utility of a given duration of time spent in some fixed health state is directly proportional to the duration. In other words, the utility function for life years is linear.
Taken together, the three properties allow for a relatively simple operationalization of QALY calculations, in which:
- the overall utility of a sequence of health states may be expressed as the sum of the utilities of each of the constituent episodes (allowed by additive independence);
- the utility of an episode may be expressed as the product of the utility for the duration of the episode times the utility for the health level of the episode (allowed by mutual utility independence);
- the utility for the episode may be further simplified as the product of the duration times the utility for the health level of the episode (allowed by risk neutrality for life years).
Since the original formulation by Pliskin et al., there have been alternative expressions of the QALY assumptions proposed. For example, Bleichrodt et al. (1997) demonstrated that the three properties proposed in the original model can be captured in only two assumptions, offering a somewhat simpler axiomatic basis for QALYs.
Alternatives To QALYs
While QALYs have become the dominant outcome measure for cost-effectiveness analyses in health and medicine, there has been steady debate in the literature about the advantages and disadvantages of QALYs, touching on an array of issues – ethical, conceptual, and practical. A good list of references for these debates through the mid-1990s may be found in the volume by Gold and colleagues (Gold et al., 1996). For a flavor of more recent contributions see Williams (1996), Nord (1999), Tsuchiya (2000), and Bleichrodt and Pinto (2005).
One of the most widely discussed alternatives to QALYs is the healthy-years equivalent, or HYE, first proposed by Mehrez and Gafni (1989). Unlike the QALY, the HYE assigns utilities to an entire sequence of health states, rather than to each individual component of this sequence. This alternative approach relaxes some of the structure imposed by the assumptions built into QALYs – discussed in the section titled ‘Key concepts’ above – for example, the assumption that health states are additively independent across time, or the requirement of constant proportional tradeoffs. Consider two simple examples. First, imagine a chronic condition that may have varying durations. For QALYs, the valuation of a health state is considered to be independent of duration, so that knowing the value attached to 1 year lived in the state enables computation of QALYs for periods of 2 years, or 5 years, or 25 years, through simple multiplication. The HYE, on the other hand, allows that the valuation of a health state may depend on its duration, and therefore calls for direct valuation of 1-year, 2-year, 5-year, and 25-year periods in the health state, which need not relate linearly to each other.
As a second example, imagine an individual’s health experience over time as transitions through a sequence of health states. The assumption in QALYs is that the total utility attached to the sequence is the sum of the utilities of each individual component (characterized by a constant health level over some duration). Thus, to compute QALYs for the entire stream requires only the estimation of the duration of each component and the value attached to the health state that is experienced during each component. For the HYE, on the other hand, the value attached to the entire sequence need not be the simple sum of the value of the individual components. This more flexible formulation allows for the possibility that the value attached to time spent in a health state may be different depending on the particular experiences that preceded the state. The disadvantage of this more flexible approach is that valuation must be undertaken on all relevant sequences of health states, which may be numerous.
Another type of summary measure that has been regarded as an alternative to QALYs is the disability adjusted life year, or DALY. The DALY was first developed for the primary purpose of quantifying the global burden of disease. In this context, it was constructed as a summary measure of population health, specifically, to be used as an indicator of the relative magnitude of losses of healthy life associated with different disease and injury causes. The construction of summary measures of population health has much in common with the construction of measures of the benefits from health interventions. Indeed, the developers of the DALY explicitly intended that the measure could be used as both a unit of account for the burden of disease, and as a metric for health benefits in the denominator of cost-effectiveness ratios (Murray et al., 1994). The major debut of the DALY in the World Bank’s World Development Report 1993 introduced applications of the measure toward both ends (World Bank, 1993). More recently, guidelines from the World Health Organization on conducting ‘generalized cost-effectiveness analyses’ – with a particular focus on health policies in developing countries – have included an explicit recommendation to use DALYs as the measure of benefit in these analyses (Tan Torres et al., 2003).
The relationship between DALYs and QALYs has been characterized as follows by developers of the DALY: ‘‘DALYs can be considered as a variant of QALYs which have been standardized for comparative use’’ (Murray and Acharya, 1997: 704–705). There are certain key distinctions between DALYs and QALYs:
- Because DALYs are negative measures that reflect health losses, the scale used to quantify nonfatal health outcomes in DALYs is inverted compared to the scale used in QALYs; that is, numbers near 0 represent relatively good health levels (or small losses) in DALYs, while numbers near 1 represent relatively poor health levels (or large losses). The inverted scale means that interventions that improve health result in DALYs averted, whereas QALYs are gained.
- Disability weights in DALYs, which are the health state valuations analogous to the ‘quality’ adjustments in QALYs, are intended to reflect the degree to which health is reduced by the presence of different conditions, whereas at least one interpretation of the weights in QALYs is based on the individual utility derived from different states.
- The standard formulation of DALYs weights healthy life lived at different ages according to a variable function that peaks at young adult ages, while QALYs do not typically incorporate unequal age weights. (It should be noted that DALYs may also be computed with equal age weights.)
- For measuring the burden of disease, years of life lost due to premature mortality at different ages are computed in reference to a standard life table, defined by the period life expectancy at birth for Japanese females at the time of the original Global Burden of Disease study. For purposes of cost-effectiveness, this distinction is largely inconsequential, since the standard life expectancy essentially cancels out when benefits of interventions are computed as the change in DALYs. As a simplified example, imagine an intervention that defers one death from age 50 to age 70, and suppose that the normative target lifespan used as the yardstick for DALYs is 80 years (irrespective of one’s current age). Then the number of DALYs averted through intervention is a change from 80-50 = 30, to 80-70 = 10, for a net of 20 DALYs averted, which is the same as the number of QALYs gained through the intervention. (Note that in the actual standard life table that is used, as in most life tables, the target life span, equal to the number of years of remaining life expectancy at age x plus x, rises slightly with advancing adult ages rather than remaining constant as per the simple example here. This will produce a slight discrepancy between DALYs averted and QALYs gained, but this difference is usually negligible.)
Calculating QALYs
The logic underlying QALY calculations is straightforward. Referring back to Figure 1, the gain in QALYs attributed to some intervention relative to an explicit comparator may be understood as the difference between the areas under the two curves tracing the health trajectory in each alternative intervention scenario. To calculate the area under each curve requires knowledge of the sequence of health states that are experienced; the duration of each health state; and the utility of each health state measured on a meaningful cardinal scale.
There are a range of conceptual and methodological issues around the calculation of health state utilities or valuations. Many areas of contention remain. Several techniques are available for eliciting health state valuations from respondents, including the standard gamble, time trade-off, person trade-off, and visual analog scale, and discussion continues about the advantages and disadvantages of each of these methods. Empirical studies have found that the different techniques produce values that differ systematically, and debates about the relative merits of the different methods refer to economic theory, comparisons of psychometric properties of the different measurement techniques, and ethical issues. Other persistent controversies relating to measurement of health utilities include the treatment of states that are regarded as worse than being dead; and appropriate ways to account for patient adaption in the valuation of health outcomes, in light of observed differences between predicted and experienced utility. Another area of ongoing discussion encompasses empirical questions regarding variation in values across different respondent groups defined by sociodemographic characteristics or by their relationship to the condition being assessed (e.g., patients, providers, or the lay public). One general approach that is widely used in deriving utility values for QALYs combines information elicited from patients and the lay public. In short, patients are asked to describe their health status using a standardized instrument comprising ratings along several key dimensions of health (for example, mobility, vision, and cognition). Utility values are then computed for the resulting multi-dimensional health states by applying scoring rules that reflect the relative importance of each dimension, as ascertained from general community surveys. The variety of issues relating to utility assessment provides fertile ground for researchers and will likely continue to inspire debate as theoretical and empirical work proceeds.
Regarding the other key inputs to QALYs, while straightforward in concept, all inputs typically are not fully observed, so models are usually needed in order to assess the movement of a typical patient through health states over time. Borrowing the definition suggested by Kuntz and Weinstein (2001: 142), a model in this context refers to ‘‘any mathematical structure that represents the health and economic outcomes of patients or populations under a variety of scenarios.’’ Much of the modeling work for economic evaluations relies on Markov models. A Markov model comprises a set of mutually exclusive and collectively exhaustive health states. Each person in the model can reside in only one health state at any point in time, and all persons residing in a particular health state are indistinguishable from one another. Transitions occur from one state to another at defined recurring intervals (Markov cycles) of equal length (such as 1 month or 1 year) according to a set of transition probabilities. These probabilities may depend on population characteristics such as age, sex, and chronic disease and may vary over time. Values are assigned to each health state to reflect the cost and utility of spending one Markov cycle in that state. By synthesizing data on costs, effects, and quality of life, a Markov model enables comparisons of the outcomes associated with different clinical strategies. Modeling strategies can accommodate QALY calculations by simulating disease progression through discrete states; tracking time spent in each state; applying utility weights to time lived in each state; and cumulating life years, accounting for state-specific weights, to compute QALYs.
Bibliography:
- Bleichrodt H and Pinto JL (2005) The validity of QALYs under non-expected utility. The Economic Journal 115(503): 533–550.
- Bleichrodt H, Wakker P, and Johannesson M (1997) Characterizing QALYs by risk neutrality. Journal of Risk and Uncertainty 15(2): 107–114.
- Drummond MF, Sculpher M, O’Brien B, Stoddart GL, and Torrance GW (eds.) (2005) Methods for the Economic Evaluation of Health Care Programmes. Oxford, UK: Oxford University Press.
- Elixhauser A, Luce BR, Taylor WR, and Reblando J (1993) Health care CBA/CEA: An update on the growth and composition of the literature. Medical Care 31(supplement 7): JS1–11, JS18–149.
- Elixhauser A, Halpern M, Schmier J, and Luce BR (1998) Health care CBA and CEA from 1991 to 1996: An updated bibliography. Medical Care 36(supplement 5): MS1–9, MS18–147.
- Fanshel S and Bush J (1970) A health status index and its application to health service outcomes. Operations Research 18: 1021–1066.
- Gold MR, Patrick DL, Torrance GW, et al. (1996) Identifying and valuing outcomes. In: Gold MR, Siegel JE, Russell LB, and Weinstein MC (eds.) Cost-Effectiveness in Health and Medicine, pp. 82–134. Oxford, UK: Oxford University Press.
- Klarman HE, Francis JOS, and Rosenthal GD (1968) Cost effectiveness analysis applied to the treatment of chronic renal disease. Medical Care 6(1): 48–54.
- Kuntz K and Weinstein MC (2001) Modelling in economic evaluation. In: Drummond M and McGuire A (eds.) Economic Evaluation in Health Care, pp. 141–171. Oxford, UK: Oxford University Press.
- Mehrez A and Gafni A (1989) Quality-adjusted life years, utility-theory, and healthy-years equivalents. Medical Decision Making 9(2): 142–149.
- Murray CJL (1994) Quantifying the burden of disease: The technical basis for disability-adjusted life years. Bulletin of the World Health Organization 72(3): 429–445.
- Murray CJL and Acharya AK (1997) Understanding DALYs. Journal of Health Economics 16(6): 703–730.
- Neumann PJ, Greenberg D, Olchanski NV, Stone PW, and Rosen AB (2005) Growth and quality of the cost-utility literature, 1976–2001. Value in Health 8(1): 3–9.
- Nord E (1999) Cost-Value Analysis in Health Care: Making Sense out of QALYs. Cambridge, UK: Cambridge University Press.
- Pliskin JS, Shepard DS, and Weinstein MC (1980) Utility functions for life years and health status. Operations Research 28(1): 206–224.
- Tan-Torres Edejer T, Baltussen R, Adam T, et al. (2004) Making Choices in Health: WHO Guide to Cost Effectiveness Analysis. Geneva, Switzerland: World Health Organization.
- Torrance GW (1996) Designing and conducting cost-utility analysis. In: Spiker B (ed.) Quality of Life and Pharmaceconomics in Clinical Trials, 2nd edn., pp. 1105–1111. Philadelphia, PA: Lippincott Williams & Wilkins.
- Torrance GW, Thomas W, and Sackett D (1972) A utility maximization model for evaluation of health care programs. Health Services Research 7(2): 118–133.
- Tsuchiya A (2000) QALYs and ageism: Philosophical theories and age weighting. Health Economics 9(1): 57–68.
- Von Neumann J and Morgenstern O (1944) Theory of Games and Economic Behavior. Princeton, NJ: Princeton University Press.
- Warner KE and Hutton RC (1980) Cost-benefit and cost-effectiveness analysis in health care: Growth and composition of the literature. Medical Care 18(11): 1069–1084.
- Weinstein MC and Stason WB (1976) Hypertension: a Policy Perspective. Cambridge, MA: Harvard University Press.
- Weinstein MC and Statson WB (1977) Foundations of cost-effectiveness analysis for health and medical practices. New England Journal of Medicine 296: 716–721.
- Williams A (1985) Economics of coronary artery bypass grafting. British Medical Journal 291: 326–329.
- Williams A (1996) QALYS and ethics: A health economist’s perspective. Social Science and Medicine 43(12): 1795–1804.
- World Bank (1993) World Development Report 1993: Investing in Health. New York: Oxford University Press.
- Zeckhauser R and Shepard D (1976) Where now for saving lives? Law and Contemporary Problems 40(4): 5–45.
- Drummond M and McGuire A (eds.) (2001) Economic Evaluation in Health Care. Oxford, UK: Oxford University Press.
- Gold MR, Siegel JE, Russell LB, and Weinstein MC (eds.) (1996) Cost-Effectiveness in Health and Medicine. Oxford, UK: Oxford University Press.
See also:
Free research papers are not written to satisfy your specific instructions. You can use our professional writing services to buy a custom research paper on any topic and get your high quality paper at affordable price.
ORDER HIGH QUALITY CUSTOM PAPER

Always on-time

Plagiarism-Free

100% Confidentiality


