
This sample Health-Related Quality of Life Research Paper is published for educational and informational purposes only. If you need help writing your assignment, please use our research paper writing service and buy a paper on any topic at affordable price. Also check our tips on how to write a research paper, see the lists of health research paper topics, and browse research paper examples.
Introduction
Health-related quality of life (HRQOL) refers to how well a person functions in their life and his or her perceived wellbeing in physical, mental, and social domains of health. HRQOL includes whether the person can carry out a range of activities of daily living such as bathing or dressing him or herself (physical functioning). It also includes whether the person can climb stairs, walk, or run. Other relevant aspects of functioning include the extent to which one is able to interact with family, friends, and others (social functioning). The functional part of HRQOL consists of behaviors that can be observed by other people.
The well-being part of HRQOL refers to internal, subjective perceptions such as vitality, pain, anxiety, depressive symptoms, and general health perceptions. These perceptions are not directly observable by others. A person who is anxious might look nervous to an external observer or someone in pain might grimace, but these external signs can be hidden, difficult to detect, and provide at best an indirect indicator of the way the person feels.
Methods Of Assessing Health-Related Quality Of Life
The target person is considered the best source of information about his or her functioning and well-being. Hence, the usual mode of assessing HRQOL is through self-reports. HRQOL data are typically gathered using either self-administered surveys (e.g., mail) or interviewer-administration (e.g., telephone).
When it is not possible to obtain HRQOL data from the target respondent, HRQOL data can be collected using a proxy (e.g., family member or clinician). Proxy responses are more often used in studies of children or adults who are severely ill or cognitively impaired. Agreement between proxy and self-reports tends to be better for more observable aspects of HRQOL, such as physical functioning, than for internal perceptions such as emotional well-being (Hays et al., 1995; Magaziner et al., 1997).
Generic Versus Targeted HRQOL Profile Measures
Generic HRQOL measures are analogous to intelligence tests in that they are designed to be relevant to anyone and allow different people to be compared to one another because they have taken the same test. Generic profile measures yield scores on multiple aspects of HRQOL.
The SF-36 is the most well-recognized generic HRQOL profile measure in the world today. It comprises 36 items selected from a larger pool of items used in the RAND Corporation’s Medical Outcomes Study (MOS). Twenty of the items are administered using a ‘past four weeks’ reporting interval. The SF-36 assesses eight health concepts using multi-item scales (35 items): physical functioning (10 items), role limitations caused by physical health problems (4 items), role limitations caused by emotional problems (3 items), social functioning (2 items), emotional well-being (5 items), vitality (4 items), pain (2 items), and general health perceptions (5 items). An additional item assesses change in perceived health during the last twelve months.
Generic HRQOL profile measures such as the SF-36 are often used to compare the relative burden of disease for different groups of patients. For example, SF-36 physical functioning and emotional well-being scores for 2864 HIV-infected individuals in a probability sample of adults with HIV receiving health care in the United States were compared to patients with other chronic diseases and to the general U.S. population (Hays et al., 2000). SF-36 physical functioning scores were about the same for adults with asymptomatic HIV disease as compared with the U.S. general population but were much worse for those with symptomatic HIV disease (by one standard deviation [SD]), and worse still (by another standard deviation) for those who met criteria for AIDS. Patients with AIDS had worse physical functioning than those with some of the other chronic diseases (epilepsy, gastroesophageal reflux disease, clinically localized prostate cancer, clinical depression, diabetes). SF-36 emotional well-being was comparable among patients with various stages of HIV disease, but was significantly worse than the general U.S. population and patients with other chronic diseases with the exception of depression. In a separate analysis from the same dataset, HRQOL for HIV patients coinfected with chronic viral hepatitis was shown to be similar to those with HIV monoinfection (Kanwal et al., 2005).
HRQOL Targeted Profile Measures
Targeted measures are constructed to fill the gaps in generic instruments by tapping aspects of HRQOL that have particular relevance to people with the characteristic of interest (e.g., age, gender, disease). A common target for these measures is a particular disease or condition. Patrick and Deyo (1989) recommended use of both a generic measure and disease-targeted items. For instance, the Kidney Disease Quality of Life (KDQOL) instrument (Hays et al., 1994) includes the SF-36 as the generic core plus items that assess symptoms and problems associated with kidney disease such as the effects of the disease on daily activities, burden of kidney disease, work, quality of social interaction, sexual function, and sleep.
Disease-targeted measures have the potential to be more sensitive to smaller differences and smaller change over time than generic measures because they are selected to be relevant to a given condition. In a study of HRQOL in men treated for localized prostate cancer, there were no differences on the SF-36 between those treated with surgery, radiation, watchful waiting, or an ageand zipcoded matched control group (Litwin et al., 1995). However, disease-targeted measures of sexual, urinary and bowel function, and distress revealed worse HRQOL among the treatment groups (e.g., radiation, surgery).
A fundamental consideration for including diseasetargeted measures in tandem with generic cores is the unique information they capture. The National Eye Institute Refractive Error Quality of Life (NEI-RQL) multiitem scales were found to account for 29% of the variance in satisfaction with vision correction item beyond that explained by the SF-36 and the National Eye Institute Visual Functioning Questionnaire (NEI-VFQ) (Hays et al., 2003). In a study of 598 persons with chronic eye diseases, the NEI-VFQ scales were found to have low correlations with the SF-36 (Mangione et al., 1998). While the SF-36 was not associated with self-rated severity of gastrointestinal tract involvement, disease-targeted scales in the Scleroderma Gastrointestinal Tract 1.0 survey were sensitive to differences in disease severity (Khanna et al., 2007).
Summary Scores For HRQOL Profile Measures
Profile measures provide multiple scores (one for each domain assessed) and more comprehensive information about a person on a range of HRQOL indicators (e.g., the eight SF-36 scales). However, there are times when summary scores are preferred. Summary scores provide parsimony, but provide less information. Factor analyses are employed to examine how higher-order factors or summary measures can be constructed over a range of HRQOL indicators. Factor analyses of the SF-36 in the United States provide strong support for two underlying factors with physical health defined primarily by measures of physical functioning, pain, and role limitations due to physical health problems, and by mental health reflected primarily by measures of emotional well-being and role limitations caused by emotional problems (Hays et al., 1994). General health perceptions, vitality, and social functioning represent both physical and mental health about equally.
The SF-36 Physical Component Summary (PCS) and Mental Component Summary (MCS) scores were derived using an orthogonal (i.e., uncorrelated) factor model (Ware et al., 1995). Inconsistent results have been found between scale scores and the PCS and MCS because ‘mental health’ scales receive negative weightings in creating the PCS whereas ‘physical health’ scales receive negative weightings in constructing the MCS. Thus, better mental health tends to lower the PCS and better physical health tends to lower the MCS. For example, a study of 536 primary care patients who initiated antidepressant treatment found that the SF-36 physical functioning, role limitations due to physical health, pain, and general health perceptions scales improved significantly by 0.3 to 0.5 standard deviations over time, but the PCS did not change significantly (Simon et al., 1998). Inconsistency can arise whenever the physical and mental scales change in a consistent direction.
Hays and colleagues (1998) derived physical and mental health summary scores using a correlated factor model in a sample of 255 female and 245 males stratified by age, race/ethnicity, and educational level to reflect the U.S. population. Farivar et al. (2007) derived alternative summary scores for the SF-36 based on a correlated factor model. The difference in factor scoring coefficients for the PCS were as follows (standard scoring vs. alternative): physical functioning (0.42 vs. 0.20), role limitations due to physical health problems (0.35 vs. 0.31), bodily pain (0.32 vs. 0.23), general health perceptions (0.25 vs. 0.20), vitality (0.03 vs. 0.13), social functioning ( 0.01 vs. 0.11), role limitations due to emotional problems (-0.19 vs. 0.03) and emotional well-being ( – 0.22 vs.-0.03). For the MCS the differences in factor scoring coefficients was as follows: physical functioning ( 0.23 vs. 0.02), role limitations due to physical health problems ( -0.12 vs. 0.03), bodily pain (-0.10 vs. 0.04), general health perceptions ( -0.02 vs. 0.10), vitality (0.24 vs. 0.29), social functioning (0.27 vs. 0.14), role limitations due to emotional problems (0.43 vs. 0.20) and emotional well-being (0.48 vs. 0.35).
The alternative scoring reduces the number and size of negative weights that produce inconsistencies between scale and summary scores.
Preference-Based HRQOL Measures
While profile measures provide a wealth of information over multiple HRQOL domains, if an intervention shows improvements in some HRQOL scales and decrements in others, it may be difficult to make an overall conclusion. In addition, attrition due to mortality poses a unique problem for profile measures. If those who die are dropped from the analysis, results can be biased. Some proposals for imputing HRQOL scores for the dead have been made (e.g., Diehr et al., 1995), but no one approach is entirely satisfactory.
Preference-based measures are designed to integrate across domains of health to produce a single summary score for each health state anchored relative to ‘dead’ (score of 0) and ‘perfect health’ (score of 1). The preference-based measure SF-6D is derived using a six-dimensional health classification scheme (physical functioning, role functioning, emotional well-being, pain, social functioning, and vitality) and a subset of items and categories from the SF-36. Preference weights for 9000 health states defined by combinations of responses to the SF-36 health survey were derived. Visual analogue and standard gamble estimating equations were developed to predict preference scores for each possible health state. The 166 participants in the valuation study consisted of health professionals, health service managers and administrators, staff at the University of Sheffield medical school, undergraduates, and patients at hospital outpatient clinics (Brazier et al., 1998). A larger study of 611 people from the UK general population was used to finalize the scoring function (Brazier et al., 2002).
O’Brien et al. (2003) compared the SF-6D with the Health Utilities Index, Mark 3 (HUI3) in a sample of 246 patients at increased risk of sudden cardiac death who were participating in a randomized trial of implantable defibrillator therapy. Mean scores differed significantly ( p < 0.05) for the SF-6D (0.58) and HUI3 (0.61). Product-moment and intraclass correlations between the two measures were only 0.58 and 0.42. Hence, future work is needed to document and explain the variation in scores produced by different preference-based measures.
Attributes Of Good Measures
The ability of HRQOL data to enhance decision making in health care, research, practice, and policy depends on the quality of the instrument used. As reviewed in the following subsections, key characteristics of a good HRQOL measure include the conceptual and measurement model, reliability, validity, minimally importance differences and interpretation of scores, respondent and administrative burden, alternative assessment modalities, and language translations.
Conceptual/Measurement Model
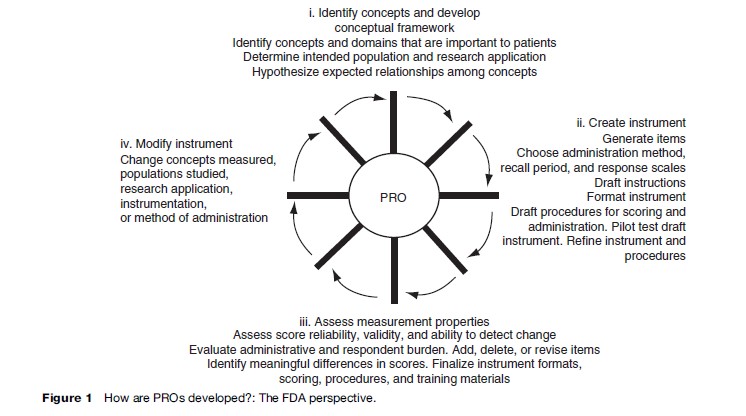
The U.S. Food and Drug Administration (2006) guidance on patient-reported outcomes (PROs) for labeling and promotional claims emphasizes the importance of identifying concepts and domains that are important to patients (Figure 1). In addition, the document argues for a clear conceptual framework or specification of how items are grouped into domains. The mapping of items to the concepts they represent is a fundamental step in the development and evaluation of HRQOL measures.
Focus groups and cognitive interviews can be very helpful in developing and evaluating the conceptual framework. Focus groups typically consist of a moderator interacting with six to twelve people representing the target population, significant others (e.g., family), or health-care providers of the target population. Focus groups may be used during all stages of instrument development and evaluation. In early stages, focus groups may respond to open-ended questions that elicit information about important issues and concerns about the HRQOL construct. This may uncover cultural differences in the experiences of the HRQOL domain. Further, it is possible to use focus groups to obtain feedback on item formulation and how items are perceived. For lengthy instruments, focus group members typically complete the instrument in advance and the moderator may ask individuals to discuss complex terms and identify unclear items. Focus groups may also help in generating hypotheses or explanations for interpreting data that have been collected (Aday, 1996).
Cognitive interviewing is a powerful tool for gaining a better understanding of the underlying or covert process involved in responding to survey items through the use of verbal probing techniques (Willis, 2005). It is used to evaluate the quality of each item in terms of a person’s understanding of the item, ability to retrieve the appropriate information, decision making on reporting retrieved information, and selection of the response. Further, cognitive interviews can be used to examine relationships between participant characteristics, such as ethnicity, and responses to HRQOL items.
The cognitive interview process includes both the administration of an instrument and the collection of additional verbal information about the survey responses (Beatty, 2004). Cognitive interviewing encompasses the more specific practice of cognitive debriefing. The term cognitive debriefing is typically associated with following up with a respondent through the use of retrospective probes, after he or she has completed an instrument with a line of questions aimed at uncovering any difficulties the person may have experienced with either the item content or instructions. For cognitive interviews that involve concurrent probing, the interviewer follows each question with a series of probes to capture participant understanding. In contrast to the retrospective cognitive debriefing, concurrent probing can yield information about the cognitive processing of the item at a point close in time to when it is first presented. It is recommended that five to twelve persons are used for cognitive interviews with a second, iterative round of testing to evaluate items revised from the first round (Willis, 2005).
Cognitive interviews can include both scripted probes to ensure that particular information is collected in every interview and then could be compared across all interviews and emergent, nonscripted probes that help interviewers make sense of gaps or contradictions in participants’ responses and provide contextual information needed to precisely define item problems. If sufficient numbers of cognitive interviews are conducted, a coding mechanism allows researchers to use quantitative methods (e.g., logistic regression) to determine if problems encountered during the interviews are due to a number of factors including cultural effects. Cognitive interviewing has been employed as an instrument evaluation tool in several HRQOL studies.
Reliability
The first attribute evaluated and reported typically is reliability, the extent to which a measure yields the same number or score each time when the construct being measured has not changed. Internal consistency reliability, the primary method of estimating reliability for multi-item scales, provides information about the associations among different items in the scale. Internal consistency is typically indexed by coefficient alpha, which is estimated using a two-way fixed-effect analysis of variance (ANOVA) that partitions the ‘signal’ (i.e., between person variance) from the ‘noise’ (i.e., interaction between people and responses to different items). Alpha can also be expressed as: a= (K-Rii)/(1 + (K -1) – R). This alternative expression illustrates how reliability increases with the number of items (K) in a scale and the intraclass correlation (estimated reliability for a single item), which is based on the correlations among items (R). A multi-item scale is typically more reliable than a single-item measure.
Test-retest reliability is the only option available for single item scales, but can be used for multi-item scales as well. Picking the optimal time interval for test-retest reliability may be difficult. It should not be too soon such that responses at the second assessment are simply memories of the first assessment, yet not so long that true change in the construct has occurred during the time interval between the initial and subsequent HRQOL assessment.
Reliability coefficients range in theory between 0 and 1, with 0.70 the standard threshold for adequate reliability for use of measures for group comparisons. For individual applications, a more stringent minimum threshold of 0.90 reliability has been suggested (Nunnally, 1978). The higher standard is needed because the error around an individual’s score is larger than the error around a group mean score. For example, even with a reliability of 0.90, the individual’s standard error of measurement – SD -square root of (1- reliability coefficient) = 0.30 × SD. If the SD of a measure is 10 as it is with the SF-36v2 scales, then the width of the 95% confidence interval around an individual’s score is 12 points (greater than a SD) as it extends from 6 points below to 6 points above the estimated true score. Using the same instrument in a group, a sample size of 25 people would result in the width of the 95% confidence interval around the group mean to be 2.4 points (approximately one-quarter of a SD).
Reliability and standard error of measurement (SEM) are inversely related; the more reliable the instrument, the smaller the SEM. This association has important implications for the sample size needed to detect group differences in HRQOL measures. For example, adjusting for the SEM, the required sample size per group to detect a difference between baseline and follow-up of about onethird of a SD is about 297 versus 227 per group if the reliability is 0.69 versus 0.84, respectively (Zimmerman and Williams, 1986).
The limitation of the traditional measures of reliability is that they assume that the reliability of a scale is fixed for all score levels. For example, a pain instrument with a reliability of 0.82 would be considered acceptable for measuring a group’s average state of pain no matter if the group experiences mild, average, or severe levels of pain. In contrast, item response theory (IRT) provides an alternative assessment of reliability in terms of item and scale information curves. The IRT information curve indicates the precision (reciprocal of the error variance) of an item or scale for measuring different levels along its underlying HRQOL trait continuum. Thus, the reliability of an item or scale varies depending on the trait level one is assessing. Items are most useful when they are appropriate or matched to the individual completing it. For instance, asking a person who is generally happy and content with life about thoughts of suicide in the last week is not likely to be informative for measuring his/her emotional distress level. Items are most informative when the answer that someone will give is less certain probabilistically (e.g., just as likely to say ‘yes’ as ‘no’ to a dichotomous question). Because of the emphasis on assessing dysfunction, information curves for measures often reflect higher precision for measuring worse HRQOL than for measuring better HRQOL. This is appropriate for determining if an intervention has an effect on the population if dysfunction is the range of the continuum targeted by the measure.
Validity
Validity is the extent to which an instrument measures that which it was intended to measure and not something else. There are three main subtypes of validity: content, criterion, and construct. Content validity is the extent to which a measure represents the appropriate content and the variety of attributes that make up the measured construct. Another way of expressing content validity is the adequacy of sampling of the material in the measure. Adequate sampling is best ensured by a plan for content and item construction before the measure is developed. Focus groups and other qualitative methods (e.g., cognitive testing) are sources for appropriate content. A group of experts can examine items and can either endorse the content validity or identify any important gaps in content. Face validity is considered a form of content validity in which the content of a scale is evaluated in terms of the extent to which it is perceived to be measuring what it is supposed to measure by patients or experts.
Criterion-related validity refers to the extent to which the measure agrees with an external standard, typically a ‘gold standard’ measure. An example would be the development of an observational measure of how well an individual is breathing and comparing it to the gold standard of a pulse oximeter that measures oxygen saturation. Because there is typically no gold standard for HRQOL measures, criterion-related validity is usually not applicable. For situations in which it is appropriate, evaluation of criterion-related validity would involve determining the extent to which the new measure is consistent or captures the essence of the gold standard measure. For example, one might employ contingency table analyses of sensitivity and specificity or area under the curve analyses to assess the level of agreement of the new measure with the standard.
Construct validity is the extent to which the measure ‘behaves’ in a way consistent with theoretical hypotheses and represents how well scores on the instrument are indicative of the theoretical construct. Construct validity evaluation includes the degree to which a measure correlates with other measures to which it is similar and does not correlate with (diverges from) measures that are dissimilar. A surplus of terminology exists in the literature that falls into the general class of construct validity. For example, the multitrait, multimethod approach to validity assessment refers to convergent and discriminant validity as aspects of construct validity. Although responsiveness (i.e., an instrument’s ability to capture sensitivity to change) is often described as a separate psychometric property of HRQOL instruments, in actuality it is one aspect of the construct validity of a measure because a valid measure should change in accordance with true underlying change (Hays and Hadorn, 1992).
Construct validity is typically examined using bivariate correlations, factor analysis, and multivariate regression models. For example, one could hypothesize that a breast cancer patient’s self-esteem was positively associated with breast-conserving surgery. One could regress self-esteem on type of surgery (e.g., lumpectomy, partial mastectomy, radical mastectomy) and background variables such as age, marital status, and educational level. A statistically significant finding for type of surgery would support the hypothesis and construct validity of the measure of self-esteem. A more complicated example is as follows. Suppose one hypothesized that larger breast size was associated with lower self-esteem in men but higher self-esteem in women. One could then compute rank order correlations separately by gender between a category measure of size (A, B, C, D, DD) and a self-esteem measure. In addition, one could regress self-esteem on a gender dummy variable (female = 1; male = 0), breast size, the interaction of female gender with size, and some background variables such as age and educational attainment. The presence of a positive significant interaction term would support the hypothesis and construct validity of the measure of self-esteem. One might also imagine more refined hypotheses, such as a quadratic effect among females such that intermediate cup size (e.g., B or C), are associated with the highest level of self-esteem.
Minimally Important Difference And The Interpretation Of Scores
The minimally important difference (MID) is the smallest change in HRQOL that is perceived by patients as beneficial or that would result in a change in treatment (Guyatt et al., 2002). Evaluating the MID is a special case of examining responsiveness to change that focuses on the people who are deemed to have had ‘minimal’ change. Hence, a fundamental aspect of estimating the MID is identifying the subgroup of people who have changed by a minimal amount. The essential step is to use external information or anchors (retrospective measures of change, knowledge about the course of health over time, clinical parameters) to identify those who have changed.

The best anchors are ones that identify those who have changed but not too much. In other words, it is important to identify the subset of people who have experienced minimal, but detectable, change. Figure 2, for example, shows a hypothetical plot of the impact on physical function of four life interventions. The change from preintervention to postintervention is displayed on the y-axis. Changes in physical function for getting hit by a feather, rock, bike, and car are 0, 2.5, 12.5, and 20, respectively. Assuming the physical function scale has a standard deviation of 10, the getting hit by a car intervention results in a substantial impact on physical function (two standard deviations). At the other extreme, the feather has no detectable impact on physical function. The bike impacts physical function by 1.25 standard deviations and the rock impacts it by about a quarter of a standard deviation. If one had the highest possible physical functioning at baseline, a decline of 1.25 standard deviations on the SF- 36 physical functioning scale would occur at follow-up by a report of being limited ‘a lot’ in vigorous activities, limited ‘a little’ in moderate activities, and limited a lot in climbing several flights of stairs. A decrease by one quarter of a standard deviation would occur if one reported being limited a little in vigorous activities.
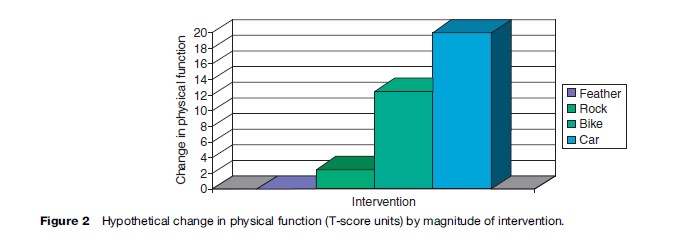
The car, bike, and feather interventions would not be good anchors for estimating the MID because they would be expected to produce changes in physical function that are either nonexistent (feather) or too large (bike or car). One might argue, however, that getting hit by a rock could be an anchor that might be useful for estimating the MID in physical function.
One type of anchor that has been used in the past is asking study participants at follow-up to report how much they changed since baseline of a study using a multiple categorical response scale such as ‘got a lot better,’ ‘got a little better,’ ‘stayed the same,’ ‘got a little worse,’ ‘got a lot worse.’ People who reported either getting a little better or a little worse constitute the minimal change subgroup. The change in HRQOL reported by this subgroup of people would then be the estimate of the MID as perceived by the patient. One should look at change for those getting worse versus getting better separately first and if the results are consistent pool them together after accounting for the difference in the direction of change (e.g., multiplying the change for those who got a little worse by negative one to account for the direction difference). It may also be informative to evaluate whether the MID estimate is invariant to location of the scale (low or high on the construct).
Retrospective self-reports are known to be subject to recall bias (Schwartz and Sudman, 1994). When retrospective change items are used as anchors, it is useful to determine if they reflect the baseline (pretest) and present (posttest) status equally. In theory, retrospective change items should correlate positively with the posttest and have a negative correlation of equal magnitude with the pretest as illustrated in the following formulas: r (x, y – x) = r (x, y) and r ( y, y – x) = r ( y, -x) = – r (x, y), where r is the correlation, x is the pretest, and y is the posttest. In reality, retrospective selfreports tend to correlate more strongly with the posttest than they do with the pretest because current status unduly influences the retrospective perception of change.
As with any anchor, use of clinical anchors requires establishing the amount of change that is a reasonable indicator of ‘minimal.’ Kosinski et al. (2000) defined minimal improvement on their clinical measures as 1–20% improvement in the number of swollen and tender joints in a study of 693 patients with rheumatoid arthritis. Although this may be a reasonable threshold, other investigators might argue for something different.
The variety of possible anchors and uncertainty in the anchor cut point that defines a minimal difference makes a single estimate of MID problematic. Using the retrospective report anchor as an example, the recall item might refer globally to change in ‘health,’ ‘health-related quality of life,’ or ‘quality of life.’ Moreover, the anchor might be worded more specifically such as ‘physical functioning,’ ‘pain,’ ‘getting along with family,’ etc. The choice of words could lead to variability in the performance of the anchor. Any specific anchor may be more or less appropriate for different HRQOL domains. For example, a vitality scale might be expected to change more than a pain scale in response to change in hematocrit. Interpreting change in response to a particular anchor should take into consideration that not all domains should change or change equally in tandem with the anchor. Other factors that can lead to variation in the estimation of the MID include whether the people being evaluated are high or low on the measure at baseline, whether they improve or decline in HRQOL over time, and whether they have similar demographic, clinical, and other characteristics (Hays and Woolley, 2000).
Respondent And Administrative Burden
Respondent burden is the time, effort, and other demands imposed on respondents to a survey. Administrative burden is the demand on those who administer the survey. A measure that has adequate reliability and validity will not be used in practice if the burden on the respondent or those who administer it is excessive.
A rule of thumb is that about 3–5 survey items can be administered per minute. Of course, these rules of thumb are general and do not take into account the nature of the items. Survey items with fewer response options are more quickly administered. For example, Hays et al. (1995) found that 832 clients enrolled in treatment programs for impaired (drinking) drivers completed about 4.5 items per minute for an alcohol screening scale with polytomous response options but they were able to complete about 8 items per minute for scales with dichotomous response options.
There is no absolute time threshold for survey administration, but surveys that can be administered in 15–30 minutes are preferred over longer surveys. Applying the 3–5 items per minute rule of thumb, 45–65 items can be administered in 15 minutes while 90–150 items can be administered in 30 minutes. Because the survey needs to be accessible to slower respondents, the lower end of the range should be used in planning survey length.
Availability In Alternate Forms
Alternative forms refer to the ability of the HRQOL instrument to be administered in different modes (e.g., mail self-administration, telephone interviews, web self-administration). The equivalence of alternative modes of administration is especially important in vulnerable and hard-to-reach populations given the advantages of mixed mode data collection for enhancing study participation rates (Brown et al., 1999).
There is consistent evidence that interviewer-administration yields more socially desirable (better HRQOL) responses than self-administration (Dillman et al., 1996). Indeed, there is consistent evidence that interviewer administration results in more positive HRQOL reports than does self-administration (McHorney et al., 1994; Weinberger et al., 1996; Jones et al., 2001). For example, persons randomized to telephone interviews had more positive SF-36 scores than those randomized to mail self-administration, leading McHorney et al. (1994: 565) to recommend modespecific norms.
Translations
Establishing the conceptual and linguistic equivalence of translated and original versions of HRQOL survey instruments is necessary. The international adaptation and evaluation of the SF-36 health survey has been one of the most systematic and coordinated efforts to date (Ware and Gandek, 1998). Efforts such as this suggest a series of important steps in translation of instruments.
If one is trying to translate an instrument developed by someone else, it is a good idea to contact the developer to obtain approval for translation and to work out an acceptable mechanism for proceeding (Acquadro et al., 1996). Working closely with the developers can be mutually beneficial and synergistic. The primary goal of the effort is to produce a translation that is linguistically and conceptually equivalent to the original version. Equivalence can only be obtained if the original and translated versions have the same meaning. Translators should be instructed to produce colloquial translations that will be understood by the general public (Acquadro et al., 1996).
The instructions, items, and response choices should be translated independently by at least two trained bilingual translators. Ideally, these translations should be carried out by local teams and both translators should be native speakers of the language into which the measure is being translated. Translators can rate the difficulty of translating each item and response scale using a 0 (not at all difficult) to 100 (most difficult) scale (Ware et al., 1996). To help select equivalent response options, the Thurstone and Chave (1929) method of equal-appearing intervals can be employed. In this method, a sample of raters (n ¼ 25 or so) is asked to rate the position of intermediate response choices using a 10-cm line anchored by the extreme (lowest and highest) response choices (Ware et al., 1996). The translators should compare their translations and reconcile discrepancies.
Two different translators should then rate the quality of the reconciled forward translation. Each item and response scale is rated for its conceptual equivalence to the original version using a 0 (not at all equivalent) to 100 (exactly equivalent) scale. Items and response scales that are rated less than 75 on the 0 to 100 scale are retranslated by the original translators until an acceptable independent rating of equivalence is obtained.
The resulting translation should then be cognitively tested in a small sample (about 10) of patients. This testing should take the form of concurrent or think-aloud interviews as well as self-administration followed by retrospective interviews (Jobe and Mingay, 1990). Following cognitive testing, the item and response options should be rewritten as necessary and a new version of the translation produced. Ideally, the next step is to convene a panel that includes the forward translators, a survey design expert, a patient, and a clinician. The panel’s job is to evaluate the conceptual equivalence of the translation and the original survey instrument. The forward translation is then finalized based on the panel’s feedback.
After approval of the process by the developers, the final forward translation should be back-translated by two other translators. Both of these translators should be native speakers of the original language of the survey. These two translators should compare their backward translations and come to agreement about discrepancies.
The reconciled back translation will then be compared against the original and each item and response scale rated for equivalence to the original version using a 0 (not at all equivalent) to 100 (exactly equivalent) rating scale. Items and response scales should be rated highly (e.g., 75 or higher on the 0–100 scale) for the translation to be approved.
The next step is field testing the translated survey instrument. At a minimum, the translation should be administered to a sample of 75 people who are native speakers of the target language. Scale equivalence should be assessed by performing standard reliability and validity testing and comparing these results to those obtained for the original sample (Hays et al., 1995). Ideally, the translated and the original versions of the instrument should be administered to a bilingual sample in counterbalanced order to allow for direct comparisons of responses for the same respondent (c.f. Coons et al., 1998).
Meaningful and valid comparisons of different groups assume that the generic measure is equivalent in the different groups. This means that the HRQOL scales should have the same level of acceptability, reliability, and validity in different segments of the population. In HRQOL studies, some attention has been paid to evaluating cross-group equivalence involving different language or race/ethnic subgroups. For example, Yu et al. (2003) compared the reliability and mean scores of the English and Chinese versions of the SF-36 in a sample of 309 Chinese nationals bilingual in Chinese and English living in the United States. Similarly, the International Quality of Life Assessment Project evaluated the equivalence between the U.S. English and translations versions of the SF-36 into multiple languages including Dutch, Spanish, German, Japanese, and Italian (Gandek et al., 1998).
Item Banking
An item bank is a collection of items that measure a single HRQOL domain that have undergone rigorous qualitative, cognitive, and psychometric review (including cross-cultural group validations), and that have been IRT-calibrated with a set of properties allowing instrument developers to select an item set matched to the characteristics of the study population (Reeve and Fayers, 2005). The bank can be used to develop short-form instruments selecting the best set of items, or used for computerized-adaptive testing (CAT). Instruments built from item banks can yield reliable and valid measurement with reduced response burden.
Another advantage of item banks is the ability in a comparison trial to tailor the item severity (not content) to the target group. For one reason or another, one group may have more depression or pain than another. The item bank can provide different sets of items (but all measuring the same construct) to the different groups, yet because the items come from the same item bank, scores can be compared. Further, item banks can offer the ability to administer repeated HRQOL assessment in a short time frame and not have to worry about issues related to memory effects for responses given on previous assessments. A well-populated item bank can provide alternative HRQOL scales all linked on the same metric.
The strength of a bank to deliver precise, valid, and efficient measurement depends, like any other HRQOL instrument, on the developmental process. An item bank should start with a conceptual framework that leads to identifying existing items that measure that domain and/ or developing new items. Once the item pool has been built of old and new items, a thorough qualitative review phase must begin evaluating the items using the techniques described above including focus groups and cognitive interviewing. Next, response data with a large sample representative of the target population must be collected and used to quantitatively review the item performance and make IRT-calibrations.
Use Of Measures In Research, Population Surveillance, And Clinical Practice
HRQOL measures can be used for a range of potential applications. The most common application to date has been for group-level comparisons in research. For example, Lorenz et al. (2006) found that each additional symptom at follow-up was associated with worsened overall health and overall quality of life ratings in a nationally representative cohort of 2267 patients in care for HIV who were surveyed in 1996 and again in 1998.
HRQOL measures are also used for population surveillance. For example, one study of U.S. Medicare managed-care beneficiaries found that age and genderadjusted annual expenditures in the year after a self-rating of health varied from $8743 for those who rated their health as poor to $1656 for those rating their health as excellent (Bierman et al., 1999). The SF-36 has been administered to Medicare beneficiaries enrolled in managed care as part of a project to monitor performance and stimulate quality improvement in managed care plans (Haffer and Bowen, 2004; Jones et al., 2004). The HUI was administered in the Joint Canada/United States Survey of Health, a binationally representative random-digit-dial telephone survey administered in both the United States and Canada to compare the health of those 18 and older in the two countries (Sanmartin et al., 2006). The Medical Expenditure Panel Survey is a nationally representative survey of health-care utilization and expenditures for the U.S. noninstitutionalized civilian population (Cohen et al., 1996) that included the SF-12 version 1 and the EQ-5D in some administrations.
Investigators with the Dartmouth Cooperative Information Project (COOP) were pioneers in the use of HRQOL measures in clinical practice. The COOP chart system was developed by a network of community medical practices that cooperate on primary care research activities. The COOP charts were developed for the purpose of making a brief, practical, and valid method to assess the functional status of adults and adolescents.
The charts are similar to Snellen charts, which are used medically to measure visual acuity quickly in busy clinical practices. Each chart consists of a title, a question referring to the status of the patient over the past 2–4 weeks, and five response choices. Each response is illustrated by a drawing that depicts a level of functioning or well-being along a 5-point ordinal scale (Nelson et al., 1990). The illustration makes the charts appear friendly without seeming to bias their responses (Larson et al., 1992).
In one study of 29 intervention and 27 control group physicians, the Dartmouth COOP Charts were used to assess HRQOL of adult patients during a single clinical encounter (Wasson et al., 1992). The ordering of tests and procedures for women was increased by exposure to the COOP Charts (52% vs. 35%; p < 0.01); the effect in men was not as significant (37% vs. 23%; p = 0.06). Although women reported no change in satisfaction with care, men claimed that the clinician helped in the management of pain (p = 0.02).
A prospective randomized study of 28 oncologists and 286 cancer patients documented more frequent discussion of chronic nonspecific symptoms ( p = 0.03) in the intervention group. HRQOL improvement was associated with use of HRQOL data ( p = 0.016) and discussion of pain and role function ( p ¼ 0.046).
Despite some encouraging results in the use of HRQOL measures in clinical practice, Greenhalgh et al. (2005) argued that more attention needs to be given to the mechanism linking HRQOL assessment to better outcomes to maximize its impact on clinical decisions.
Wasson and James (2001) discussed how HRQOL assessment and feedback could be used at multiple levels including clinic, school, workplace, and community. They note that in the clinic patients and providers are encouraged to discuss the patient’s HRQOL. In the school system, aggregated information can be used to target programs to meet student needs. Health assessment and personal feedback at school (Wasson et al., 1995) or in the workplace can be offered to improve health and reduce health-care costs. Finally, the Internet provides a means by which health assessment and feedback can be used to improve the health of the community.
Bibliography:
- Acquadro C, Jambon B, Ellis D, and Marquis P (1996) Language and translation issues. In: Spilker B (ed.) Quality of Life and Pharmacoeconomics in Clinical Trials, 2nd edn., pp. 575–585. Philadelphia, PA: Lippincott-Raven
- Bierman AS, Bubolz TA, Fisher ES, and Wasson JH (1999) How well does a single question about health predict the financial health of Medicare managed care plans? Effective Clinical Practice 2: 56–62.
- Brazier J, Usherwood T, Harper R, and Thomas K (1998) Deriving a preference-based single index from the U.K. SF-36 Health Survey. Journal of Clinical Epidemiology 51: 1115–1128.
- Brazier J, Roberts J, and Deverill M (2002) The estimation of a preference-based measure of health from the SF-36. Journal of Health Economics 21: 271–292.
- Brown JA, Nederend SE, Hays RD, Short PF, and Farley DO (1999) Special issues in assessing care of Medicaid recipients. Medical Care 37: MS79–MS88.
- Cohen JW, Monheit AC, Beauregard KM, et al. (1996) The Medical Expenditure Panel Survey: A national health information resource. Inquiry 33: 373–389.
- Coons SJ, Alabdulmohsin SA, Draugalis JR, and Hays D (1998) Reliability of an Arabic version of the RAND 36-Item Health Survey 1.0 (a.k.a. SF-36) and its equivalence to the U.S.-English version. Medical Care 36: 428–432.
- Diehr P, Patrick D, Hedrick S, et al. (1995) Including deaths when measuring health status over time. Medical Care 33: AS164–A172.
- Dillman DA, Sangster RL, Tarnai J, and Rockwood TH (1996) Understanding differences in people’s answers to telephone and mail surveys. In: Braverman MT and Slater JK (eds.) Advances in Survey Research: New Directions for Evaluation vol. 70, pp. 45–62. San Francisco, CA: Jossey-Bass.
- Farivar SS, Cunningham WE, and Hays RD (2007) Correlated physical and mental health summary scores for the SF-36 and SF-12 health survey, vol. 1. Health and Quality of Life Outcomes 5: 54.
- Gandek B, Ware JE, Aarons NK, et al. (1998) Tests of data quality, scaling assumptions, and reliability of the SF-36 in eleven countries: Results from the IQOLA Project. Journal of Clinical Epidemiology 51: 1149–1158.
- Greenhalgh J, Long AF, and Flynn R (2005) The use of patient reported outcome measures in routine clinical practice: Lack of impact or lack of theory? Social Science and Medicine 60: 833–843.
- Guyatt GH, Osoba D, Wu AW, et al. (2002) Methods to explain the clinical significance of health status measures. Mayo Clinic Proceedings 77: 371–383.
- Haffer SC and Bowen SE (2004) Measuring and improving health outcomes in Medicare: The Medicare HOS program. Health Care Financing Review 25: 1–3.
- Hays RD and Hadorn D (1992) Responsiveness to change: An aspect of validity, not a separate dimension. Quality of Life Research 1: 73–75.
- Hays RD, Marshall GN, Wang EYI, and Sherbourne CD (1994) Four-year cross-lagged associations between physical and mental health in the Medical Outcomes Study. Journal of Consulting and Clinical Psychology 62: 441–449.
- Hays RD, Kallich JD, Mapes DL, Coons SJ, and Carter WB (1994b) Development of the Kidney Disease Quality of Life (KDQOL) Instrument. Quality of Life Research 3: 329–338.
- Hays RD, Anderson R, and Revicki DA (1995) Psychometric evaluation and interpretation of health-related quality of life data. In: Shumaker S and Berzon R (eds.) The International Assessment
- of Health-Related Quality of Life: Theory, Translation, Measurement and Analysis, pp. 103–114. Oxford, UK: Rapid Communications.
- Hays RD, Merz JF, and Nicholas R (1995b) Response burden, reliability, and validity of the CAGE, Short-MAST, and AUDIT alcohol screening measures. Behavior Research Methods, Instruments, and Computers 27: 277–280.
- Hays RD, Vickrey B, Hermann B, et al. (1995c) Agreement between self-reports and proxy reports of quality of life in epilepsy patients. Quality of Life Research 4: 159–168.
- Hays RD, Mangione CM, Ellwein L, et al. (2003) Psychometric properties of the National Eye Institute – Refractive Error Quality of Life Instrument. Ophthalmology 110: 2292–2301.
- Hays RD, Prince-Embury S, and Chen H (1998) RAND-36 Health Status Inventory. San Antonio, TX: Psychological Corporation.
- Hays RD, Cunningham WE, Sherbourne CD, et al. (2000) Healthrelated quality of life in patients with human immunodeficiency virus infection in the United States: Results from the HIV Cost and Services Utilization Study. American Journal of Medicine 108: 714–722.
- Jobe JB and Mingay DJ (1990) Cognitive laboratory approach to designing questionnaires for surveys of the elderly. Public Health Reports 105: 518–524.
- Jones D, Kazis L, Lee A, et al. (2001) Health status assessments using the Veterans SF-12 and SF-36: Methods for evaluating outcomes in the Veterans health administration. Journal of Ambulatory Care Management 24: 68–86.
- Jones N, Jones SL, and Millar NA (2004) The Medicare Health Outcomes Survey program: Overview, context, and near-term prospects. Health and Quality of Life Outcomes 2: 33.
- Kanwal F, Gralnek IM, Hays RD, et al. (2005) Impact of chronic viral Hepatitis on health-related quality of life in HIV: Results from a nationally representative sample. American Journal of Gastroenterology 100: 1984–1994.
- Khanna D, Hays RD, Park GS, et al. (2007) Development of a preliminary scleroderma gastrointenstinal tract 1.0 (SSC-GIT 1.0) quality of life instrument. Arthritis Care and Research 57: 1280–1286.
- Kosinski M, Zhao SZ, Dedhiya S, Osterhaus JT, and Ware JE (2000) Determining the minimally important changes in generic and disease-specific health-related quality of life questionnaires in clinical trials of rheumatoid arthritis. Arthritis and Rheumatolgy 43: 1478–1487.
- Larson CO, Hays RD, and Nelson EC (1992) Do the pictures influence scores on the Dartmouth COOP charts? Quality of Life Research 1: 247–249.
- Litwin M, Hays RD, Fink A, et al. (1995) Quality of life outcomes in men treated for localized prostate cancer. Journal of the American Medical Association 273: 129–135.
- Lorenz KA, Cunningham WE, Spritzer KL, and Hays RD (2006) Changes in symptoms and health-related quality of life in a nationally representative sample of adults in treatment for HIV. Quality of Life Research 15: 951–958.
- Magaziner J, Zimmerman SI, Gruber-Baldini AL, Hebel R, and Fox KM (1997) Proxy reporting in five areas of functional status: Comparison with self-reports and observations of performance. Amercian Journal of Epidemiology 146: 418–428.
- Mangione CM, Lee PP, Pitts J, Gutierrez P, Berry S, and Hays RD (1998) Psychometric properties of the National Eye Institute Visual Function Questionnaire, the NEI-VFQ. Archives of Ophthalmology 116: 1496–1504.
- McHorney CA, Kosinski M, and Ware JE (1994) Comparisons of costs and quality of norms for the SF-36 health survey collected by mail versus telephone interview: Results from a national survey. Medical Care 32: 551–567.
- Nelson EC, Landgraf JM, Hays RD, Wasson JH, and Kirk JW (1990) The functional status of patients: How can it be measured in physicians’ offices? Medical Care 28: 1111–1126.
- Nunnally J (1978) Psychometric Theory, 2nd edn. New York: McGraw-Hill.
- O’Brien BJ, Spath M, Blackhouse G, Severens JL, Dorian P, and Brazier J (2003) A view from the bridge: Agreement between the SF-6D utility algorithm and the Health Utilities Index. Health Economics 12: 975–981.
- Patrick DL and Deyo RA (1989) Generic and disease-specific measures in assessing health status and quality of life. Medical Care 27: S217–S232.
- Reeve BB and Fayers P (2005) Applying item response theory modeling for evaluating questionnaire items and scale properties. In: Fayers P and Hays R (eds.) Assessing Quality of Life in Clinical Trials: Methods and Practice, pp. 55–73. Oxford, UK: Oxford University Press.
- Sanmartin C, Berthelot JM, Ng E, et al. (2006) Comparing health and health care use in Canada and the United States. Health Affairs 25: 1133–1142.
- Schwartz N and Sudman S (1994) Autobiographical Memory and the Validity of Retrospective Reports. New York: Springer-Verlag.
- Simon GE, Revicki DA, Grothaus L, et al. (1998) SF-36 summary scores: Are physical and mental health truly distinct? Medical Care 36: 567–572.
- Thurstone LL and Chave EJ (1929) The Measurement of Attitude. Chicago, IL: University of Chicago Press.
- S. Food and Drug Administration (2006) Draft guidance for industry on patient-reported outcome measures: Use in medicinal product development to support labeling claims. Federal Register 71: 5862–5863.
- Velikova G, Booth L, Smith AB, et al. (2005) Measuring quality of life in routine oncology practice improves communication and patient well-being: A randomized controlled trial. Journal of Clinical Oncology 22: 714–724.
- Ware JE and Gandek B (1998) Overview of the SF-36 health survey and the international quality of life assessment (IQOOLA) project. Journal of Clinical Epidemiology 51: 903–912.
- Ware JE, Kosinski M, Bayliss MS, et al. (1995) Comparison of methods for the scoring and statistical analysis of SF-36 health profile and summary measures: Summary of results from the Medical Outcomes Study. Medical Care 33: AS264–279.
- Ware JE, Gandek BL, and Keller SD and the IQOLA Project Group (1996) Evaluating instruments used cross-nationally: Methods from the IQOLA project. In: Spilker B (ed.) Quality of Life and Pharmacoeconomics in Clinical Trials, pp. 681–692. Philadelphia, PA: Lippincott-Raven.
- Wasson J, Hays R, Rubenstein L, et al. (1992) The short-term effect of patient health status assessment in a health maintenance organization. Quality of Life Research 1: 99–106.
- Wasson JH, Kairys SW, Nelson EC, et al. (1995) Adolescent health and social problems: A method for detection and early management. The Dartmouth Primary Care Cooperative Information Project (COOP). Archives of Family Medicine 4: 51–56.
- Wasson JH and James C (2001) Implementation of web-based interaction technology to improve the quality of a city’s health care. Journal of Ambulatory Care Management 24: 1–9.
- Weinberger M, Oddone EZ, Samsa GP, and Landsman PB (1996) Are health-related quality-of-life measures affected by the mode of administration? Journal of Clinical Epidemiology 49: 135–140.
- Yu J, Coons SJ, Draugalis JR, Ren XS, and Hays RD (2003) Equivalence of the Chinese version and the U.S.-English version of the SF-36 Health Survey. Quality of Life Research 12: 449–457.
- Zimmerman DW and Williams RH (1986) Note on the reliability of experimental measures and the power of significance tests. Psychological Bulletin 100: 123–124.
- Hahn EA, Cella D, Chassany O, Fairclough DL, Wong GY, and Hays RD (2007) A comparison of the precision of health-related quality of life data relative to other clinical measures. Mayo Clinic Proceedings 82(10): 1244–1254.
- Hays RD, Brodsky M, Johnston MF, Spritzer KL, and Hui K (2005) Evaluating the statistical significance of health-related quality of life change in individual patients. Evaluation and the Health Professions 28: 160–171.
- Reeve BB, Hays RD, Bjorner JB, et al. (2007) Psychometric evaluation and calibration of health-related quality of life item banks: Plans for the Patient-Reported Outcome Measurement Information System (PROMIS). Medical Care 45: S22–S31.
- Revicki DA, Cella D, Hays RD, Sloan JA, Lenderking WR, and Aaronson NK (2006) Responsiveness and minimal important differences for patient reported outcomes. Health and Quality of LifeOutcomes 4: 70.
See also:
Free research papers are not written to satisfy your specific instructions. You can use our professional writing services to buy a custom research paper on any topic and get your high quality paper at affordable price.
ORDER HIGH QUALITY CUSTOM PAPER

Always on-time

Plagiarism-Free

100% Confidentiality


